Section 1: Q1 2020 Outlook
Current Risks of a Reserve Currency Trap
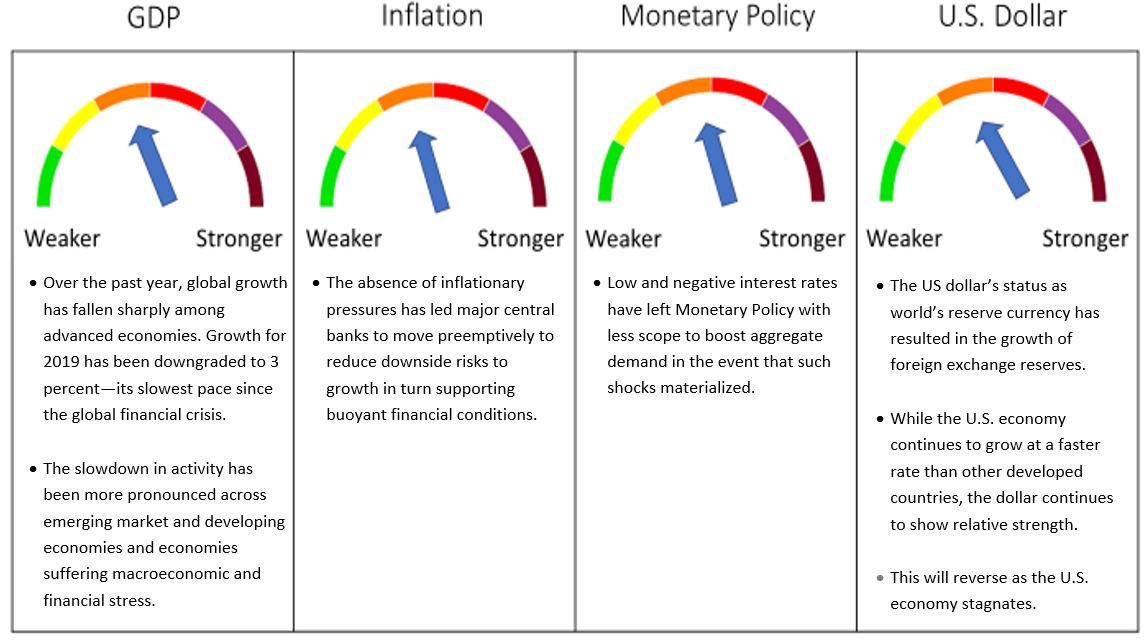
The U.S. economy represents 33% of the global economy, but its spill-over effects on the rest of the world are amplified by the dominant role of the US dollar (USD) in international payments, debt issuance, and FX reserves.i
The trust and confidence that the world has in the ability of the United States to pay its debts have anointed the dollar as the most redeemable currency, facilitating world commerce. This has led to the rapid accumulation of foreign exchange (FX) reserves throughout the global economy over the last 25 years.
As global asset allocators, our ETF Portfolio Models are exposed to foreign currency risk -primarily US dollars. Relative currency movement can be significant and have a positive or negative impact on investment returns. As with our approach to all asset classes, we want to participate on the upside and protect on the downside.
In the case of currency exposure, while we may be allocating specifically for downside protection in a non-Canadian asset class, i.e., the U.S., it may be the case that a weaker US dollar could diminish the benefit of the U.S. exposure. In these events, we apply a neutral hedge to the entire portfolio.
In this Q1 2020 Outlook, we take a look at the risks that exist of an unexpected shift in global central bank US dollar reserve balances.
The US dollar reserve status is based largely on the size and strength of the U.S. economy and the dominance of U.S. financial markets. Despite large deficit spending, trillions of dollars in foreign debt, and the printing of US dollars and US Treasury securities remain the safest store of money.
The dominance of the US dollar, reflected in its role as a global anchor for prices and interest rates, can force central banks to hold excessive USD-denominated foreign exchange reserves to match the significant USD exposure from trade and borrowing of the respective economy. The dominant role of the USD in credit and investment markets impacts investment flows to emerging economies by increasing volatility. Investment flows to emerging markets can reverse much faster than they have built up over time, making them act like very destructive pro-cyclical amplifiers in crisis situations. The role that oil prices play in the level of the USD is significant but may now be overshadowed by the sheer volume of dollar reserves that are now on the balance sheets of central banks around the globe.
A New Relationship Between Oil and the US Dollar
Considering the new dynamics of the global energy market, the United States has become the world’s marginal producer of oil products, and the US dollar has been seen to trade more like a petrodollar since 2015.
A barrel of oil is priced in US dollars across the world, so by definition, strength in the US dollar means it takes fewer greenbacks to buy a barrel of oil (all else equal) and weakness in the US dollar makes the price of oil appear higher in dollar terms. Each uptick and downtick in the dollar or in the price of the commodity generates an immediate realignment between the US dollar and numerous forex crosses. These movements are less correlated in nations without significant crude oil reserves, like Japan, and more correlated in nations that have significant reserves like Canada, Russia, and Brazil.
Many nations leveraged their crude oil reserves during the energy market’s historic rise between the mid-1990s and mid-2000s, borrowing heavily to build infrastructure, expand military operations, and initiate social programs. Those bills came due after the 2008 economic collapse, where some countries deleveraged while others doubled down, borrowing more heavily against reserves to restore trust and trajectory to their wounded economies.
These heavier debt loads helped keep growth rates high until global crude oil prices collapsed in 2014, dumping commodity-sensitive nations into recessionary environments. Canada, Russia, Brazil, and other energy-rich countries have struggled since then.
Because the United States has historically been a net importer of oil products, rising oil prices meant that the United States’ current account deficit would rise as citizens and companies shipped more currency abroad. Due primarily to the success of horizontal drilling and fracking techniques, the U.S. shale revolution has dramatically increased domestic petroleum production. The United States became a net exporter of refined petroleum products in 2011 and has now become the third-largest producer of crude oil after Saudi Arabia and Russia.iii According to the Energy Information Administration, the United States is currently about 90% self-sufficient in terms of total energy consumption.iv Economically, this means that higher oil prices no longer lead to a higher U.S. deficit, and in fact, can decrease the deficit in certain situations.
Canada is an Important Net Exporter of Oil
When it comes to the US/Canadian dollar relationship, the USD/CAD exchange rate is determined by the demand and supply of Canadian and US dollars. The CAD has a high correlation to U.S. oil because of the large portion of CAD oil exports that are shipped to the United States.
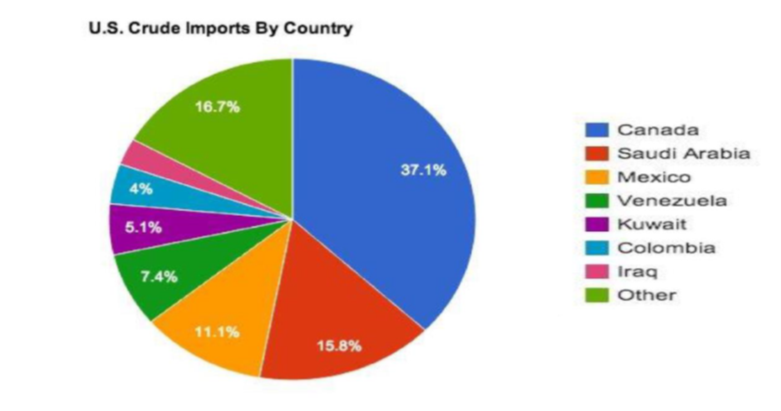
Canada has the third largest volume of oil reserves in the world after Saudi Arabia and Venezuela. Canada’s economy is dependent on exports and is the fourth largest exporter of crude oil in the world.v Approximately 96% of its exports go to the U.S., including over 3 million barrels of oil and petroleum products per day.vi Canada and OPEC Countries represent the major sources of U.S. petroleum imports at 38% and 34% respectively. Because of the volume involved, it creates a huge amount of demand for Canadian dollars.
Due to the country’s status as a net exporter of oil, its currency in relation to the USD is highly correlated to oil prices, meaning that they move in similar directions to each other. Other factors can influence the USD/CAD exchange rate including the relative inflation rate, interest rates, balance trade, public debt, OPEC decisions, political stability, and economic performance.
The 2008 financial crisis, the 2015 oil slump, and correlation breaking down in 2018 are all notable events on the timeline. Despite the history of correlation between CAD and crude, the relationship appears to have broken down late 2018 when oil’s surge made the Canadian dollar decline. This divergence is due to factors such as OPEC policies being a key influencer of oil price rather than supply and demand factors, monetary policy, and Canada’s efforts to diversify its economy and lessen its reliance on oil.
A New Dominant Factor Driving Foreign Exchange Rates and the US Dollar: The Failed Clean-Up of the Financial Crisis
A benefit of crises and recessions is that they remove both unproductive firms and financial excess, creating space for more productive firms and fresh financial investment. This was not allowed to happen after the Recession of 2008 and is why the economic recovery from the crisis was so weak. More than ten years later, through FX reserves and through QE programs, central banks globally hold government bonds issued by a relatively small number of advanced economies.
The global financial crisis (GFC) was a massive failure of risk-hedging in the financial sector, combined with both regulatory failures and dangerous and deeply embedded incentives. While the extraordinary measures used to stop the crisis from mutating into a systemic meltdown can be considered appropriate, extending these measures through the past decade cannot.
The U.S. recapitalized, merged, and permitted the failure of some banks, but Europe chose the opposite approach resulting in undercapitalized and ailing banks surviving. However, the most impactful mistakes were made after the GFC on both sides of the Atlantic. Many central banks enacted zero or negative interest rate policies and started asset purchase Quantitative Easing (QE) programs run through the commercial banks. In the U.S., the Fed purchased securities from authorized Primary Dealer banks by crediting reserve balances to the Fed accounts associated with each dealer counterparty. These intermediary banks paid the sellers of bonds (households, funds, banks, etc.) and the Fed compensated the banks with reserves. In practice, the Fed forced excess reserves onto the balance sheets of banks far beyond levels they would have acquired independently. Because of the higher supply of reserves system-wide, their marginal benefit decreased, bidding-up the prices of various securities. This led the banks to issue additional and often riskier loans until the balance of the marginal benefits was restored. Also, because QE and low policy rates depressed long-term rates, many of the securities that the commercial banks held had no yield advantage over reserves, making the banks more likely to substitute less-liquid securities with more credit risk.
Using QE, central banks can buy various fixed income assets including government bonds, corporate bonds, asset-backed securities, and in a few cases, equities (in the case of Japan, for example). However, the bulk of QE programs concern government bonds with the goal of curbing long-term interest rates across economies. Of the USD 11 trillion of QE programs, it is estimated that USD 9 trillion originate from central banks’ acquisitions of government bonds from the countries concerned.vii
Despite increased diversification, the bulk of FX reserves are still held in government bonds issued in a select number of advanced economies including the U.S., Europe, and Japan. Approximately 70% of global reserves (ex-gold) are invested into the government bonds issued by these economies. This means that either through FX reserves or through QE programs, central banks hold around USD 18 trillion of government bonds issued by a relatively small number of advanced economies.viii The total stock of government debt issued by these countries was around USD 40 trillion at the end of 2018.ix This means that central banks currently hold nearly half of global ‘safe assets’, i.e., government bonds issued by leading advanced economies such as the U.S., Japan, European states, and a few others.
Falling current account surpluses point to lower growth in FX reserves. But given the safe haven status of Japan and Switzerland in times of geopolitical uncertainty, they may need further interventions to prevent their currencies from appreciating too much.
The growth in FX reserves managed by Emerging Markets grew with the growth of emerging market economies and the commodity price boom. It continued uninterrupted after the financial crisis of 2008 as growth in Emerging Markets remained resilient, despite the recession in advanced economies. Oil prices were quick to recover from the temporary drop experienced during the most acute phase of the global crisis, thus filling the coffers of commodity-exporting economies.
The massive holdings of government bonds by central banks through FX reserve and QE raises two important questions.
At a policy level, is there a potential conflict of interest between monetary policy and asset management objectives?
Should central banks become concerned about potential losses on their holdings, given their focus on capital protection, will they be tempted to adopt a pro-cyclical behavior. Ultimately, this is an issue of international coordination among central banks as reserves held by emerging markets are often invested into bonds acquired by advanced economies’ central banks via QE programs. This international coordination may dominate over underlying demand and supply drivers including global oil demand.
The second question relates to investment risk. Can central banks weather the inevitable drop in prices that will accompany a future rise in interest rates?
As a result of the decline in global interest rates to zero or even negative levels, government bonds are a very expensive asset in both absolute and relative terms. Central banks are exposed to potentially large losses should interest rates rise. While it is true that central banks often hold bonds until maturity accounted for on an accrual basis, since most of these institutions adopt a mark¬ to-market approach in the measurement of their investment portfolio, any drop in prices on such holdings is reflected in their reported profits and losses. For central banks doing QE, the risk is further increased by significant holdings of these additional fixed income assets.
The dominance of the USD reflects several factors such as the size and depth of its financial markets, and the U.S. dominance in global affairs. From an investment perspective, the USD is the ultimate safe-haven currency and during periods of heightened global risk, investors flock to the U.S. Treasury market. This has not changed over the last 25 years and it is still true today as shown by the rise of the USD when uncertainty in global markets rises.
Central banks may engineer economic growth and generate moderate but manageable inflation, but the stresses that have accumulated on central bank balance sheets may be felt as reversing interest rates eventually happen. We will be carefully monitoring this.
Section 2: 4 Themes
Theme 1: Gold is a Safe Haven
Gold has long been recognized as a safe haven, an asset that investors seek out for protection and security during uncertain times. In early 2020, tensions in the Middle East, driven by the U.S.-Iran confrontation, supported safe-haven flows, pushing the gold price to a six-year high.
Other reasons for the strength in gold prices include:
• A technical breakout
• Bullish positioning in derivatives markets
• Light trading volumes
• Portfolio rebalancing at the end of 2019 especially as investors hedged risk asset allocations
• Federal Reserve repo activity
• Rebalancing ahead of 2020
According to the World Gold Council, of the current average global annual demand of about 4350 tonnes, about 10% of that comes from central banks. With purchases of over 600 tonnes in 2018, central banks bought more than their long-term average in that year. This trend has continued in 2019 and early 2020.x As we have highlighted in this report, gold’s behavior is highly correlated with the US dollar. And today, the lack of credit risk makes gold an attractive reserve monetary asset among central banks.
Over the last few decades, investors have shunned gold because it doesn’t produce any income, and therefore the opportunity cost of holding it was significant. In the current era of low and negative interest rates, that opportunity cost is less of a factor, thus highlighting gold’s diversification benefits.
While bonds and cash may also increase portfolio efficiency, gold is an attractive alternative because it is less impacted by interest rates. Rising interest rates put downward pressure on bond valuations, which can make holding them less attractive to investors. Additionally, negative interest rates may push cash yields to negative, on a real basis. Gold also has a low correlation to equities and a historically low correlation to bonds. Moreover, this low correlation to major asset classes holds in both times of expansion and recession. During times of expansion, goods and products that rely on gold, such as jewelry and technology, are often in high demand. In times of recession, there is a gold surge among people seeking a financial safe haven. The benefits of low correlation to stocks and bonds aren’t limited to any one type of investor or one particular risk profile.
The most recent annual statistics from the World Gold Council indicate that the main buyers of gold in 2018 were the central banks of Russia (274 tonnes), Turkey (51 tonnes), Kazakhstan (51 tonnes), India (42 tonnes) and Hungary (28 tonnes). China, which only bought 10 tonnes in 2018, increased its gold purchases in 2019.xi
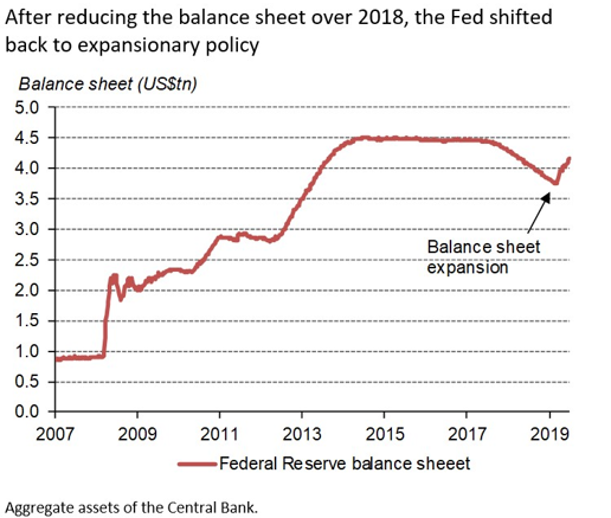
The Fed began reducing their balance sheet in 2018 but reversed this decision in the second half of 2019. They began regular repurchase market injections totaling nearly US$500 billion in the fourth quarter of 2019.xii This activity has continued into 2020 and has been described by some market participants simply as another form of QE – often dubbed “QE light” – causing some investors to worry about liquidity in the Treasury market as a whole. Historically, expansions of QE have led to increases in the gold price.
As highlighted in this report, for several countries, diversification away from US dollar assets has a strategic component. Not only does gold not have a default risk, it is not a title that has to be enforced via Western-based courts nor is it dependent on the U.S.-led financial system.
The Fed began to increase their balance sheet in Q4 2019
SOURCE: BLOOMBERG, WORLD GOLD COUNCIL
Theme 2: Oil Prices and Geopolitical Risk
Early in January 2020, in a “flight-to-safety” move following the bombings of U.S. bases in Iraq, gold and oil both rallied sharply but following the announcement that Iran was “standing down,” oil dipped while gold was up. And while gold is one of the strongest performing asset classes this year, oil is one of the weakest.xiii
From the perspective of the oil market, there has been a major structural change to the market that may offer an explanation. In the past, oil prices were the main transmission mechanism from major Gulf conflicts to the broader global economy and financial markets. However, the U.S. is now a net exporter of petroleum products, which was not the case during either the first or second Gulf War. The U.S. has essentially achieved energy independence and it can now use its own supplies to offset the impact of Middle Eastern supply shocks. It appears that oil market participants would need to see sustained physical market disruption to justify adding significant risk premia to energy prices.
U.S. Net Imports of Crude Oil and Petroleum Products
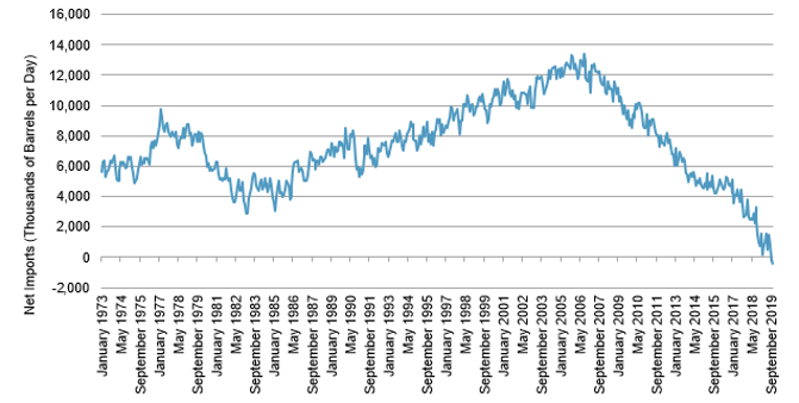
SOURCE: U.S. ENERGY INFORMATION ADMINISTRATION
The law of unintended consequences is hard at work when one considers any type of escalation in the conflict between the U.S. and Iran. And while the Strait of Hormuz has not been blocked, the option cannot be completely ruled out. It is important to think through the potential effects that a blockade could have not only on pricing or availability of crude but also on the geopolitical power transfer to a player like Russia, who is already seen as a strategic and diplomatic beneficiary of the U.S.-Iran conflict as well as the forced departure of U.S. forces from Iraq.
One of the reasons why OPEC has had such a great influence on the world’s crude market is its ability to increase (or decrease) production at any given time to dampen potential swings in oil prices. This ability hinges mostly on OPEC’s most powerful member (not only in terms of crude supply or spare capacity): Saudi Arabia, which disposes of OPEC’s bulk, and the world’s largest, crude spare capacity, approximately 1.5-2 million barrels per day.xiv With a blockade or severe limitation in traffic in the Strait of Hormuz, Saudi Arabia’s ability to release its spare capacity to the market would be greatly impeded.
U.S. shale producers who in the beginning benefit from high crude prices cannot be helpful in the same way Saudi Arabia can. Shale production can respond quickly to changing market conditions—much quicker than conventional crude production—but not as quick as a guarantee of an immediate release of additional volumes.
Important to consider also is that since U.S. crude production is in the hands of private companies, it is dictated by the market. It cannot be stopped at a certain price level but will flow until the market saturates. Also, U.S. crude quality differs substantially from Saudi crude. U.S. shale is lower in density (lighter) and sweeter (includes less sulfur) and, as such, cannot immediately act as a substitute.
One country that can benefit is Russia. Russia produces the “right” quality of crude (a substitute for the crude potentially locked in by the Strait of Hormuz), and according to a Russian government statement, it holds spare capacity of 500,000 barrels per day.xv The country cut its oil production due to an agreement with OPEC to prevent oil prices from falling too low in a high-supply environment. With oil prices rising and OPEC generally unable to provide relief, Russia and its oil companies (generally not happy with the production cuts) would surely jump at the opportunity to make the extra buck. Higher prices and production would also benefit Russian companies, as crude is traded in US dollars and the country needs currency reserves after the U.S.-imposed sanctions on Russian financial institutions following Russia’s invasion of Ukraine and interference in U.S. elections.
Russia also stands to gain geopolitical influence. Russia’s leverage in the global oil market has increased in the recent years. The country has become an important partner to OPEC in its struggle to remain the deciding entity to influence oil prices after the U.S. shale revolution unfolded. A blockade of the Strait of Hormuz could potentially strengthen Russia’s position in Asia since about three-fourths of the crude that passes through the Strait lands there.xvi This is added to the increasing importance of Russian natural gas that flows to the Chinese market via the newly opened Power of Siberia pipeline. If OPEC’s crude exports were significantly impaired by Iran-U.S. conflict, Russia would stand to profit handsomely in terms of both actual revenues and in terms of geopolitical influence, as recent military exercises among Russia, China, and Iran in the Gulf of Oman remind us.
Theme 3: Ultra-Low Rates
Central banks around the world cut interest rates in 2019 to stoke economic growth. Population aging and weaker productivity are set to constrain growth, softening demand for credit. Technology, low inflation, and demographics have fed the demand for fixed income securities and driven interest rates down around the world. Ultra-low interest rates have enhanced household wealth by boosting prices for housing and equities while at the same time hurting savers and pensioners.
Adding in globalization and a slowdown in Europe, an inability to get the economy moving in Japan and the need of the central bank to react have all continued to feed the move to zero and negative rates.
The era of extraordinarily low interest rates has forced central banks to become more creative in responding to periods of economic weakness. They are now in a trap that forces these banks to rely on unconventional monetary policies, including forward guidance, quantitative easing, funding for credit, and negative interest rates, which all may turn out to be less effective than traditional rate cuts.
The amount of global debt trading at negative yields hit a record US$17 trillion in August 2019, as more investors were willing to accept a negative rate in exchange for a safe place to park their money.xvii
In Canada, we have not seen sub-zero rates on Canadian dollar issuance. But US$85 billion of mostly euro-denominated Canadian debt (provincial, corporate, and covered bonds) is trading at negative yields.xviii Outside of Canada, positive real yields after inflation exist in long-term interest rates in Portugal, Spain, Italy, and the 30-year treasury in the U.S. The 10-year treasury, at the headline level, remains negative.
Negative interest rates are toxic for the financial system. For now, the global financial system has an out in that the reserve currency of the world, the US Dollar, has the highest positive rates, providing a buffer for now.
Theme 4: Slowing Global Growth, Tariffs, and Trade
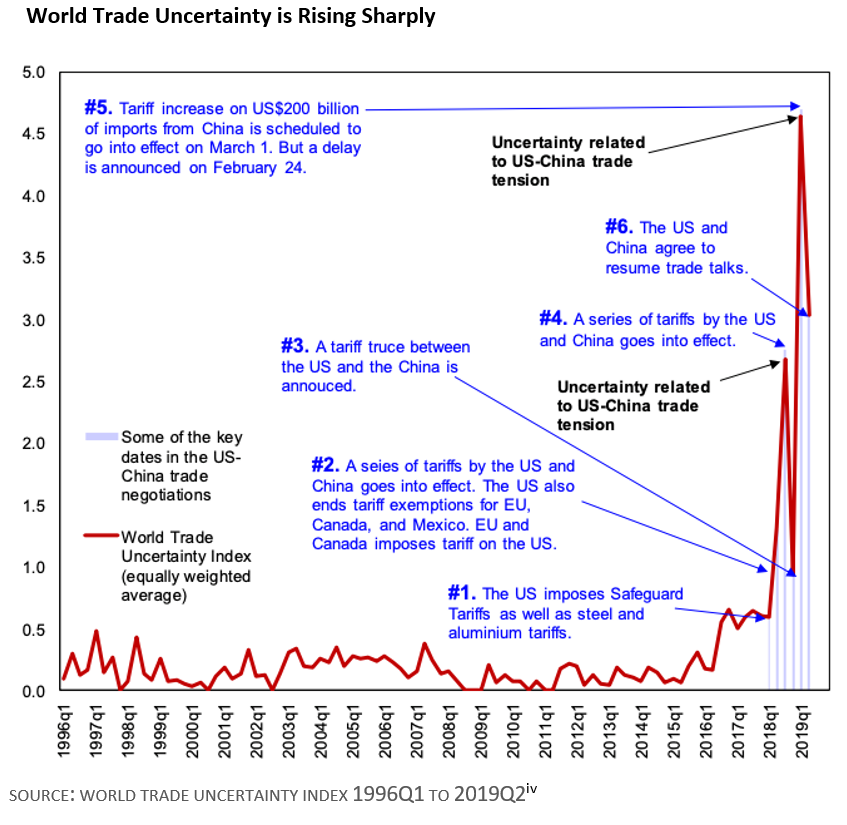
Global GDP is on track to rise 3%, the slowest pace in a decade, reflecting sagging business confidence that undermined investment and trade. Global trade volumes fell in 2019 for the first time since the Great Recession, reflecting rollercoaster U.S.-China trade negotiations, a lack of progress on Brexit, and political unrest in Hong Kong and some Latin American countries. Manufacturers were hardest hit, with the global measure of activity contracting for six straight months. Business investment in OECD countries edged up 1% in the first half of 2019, a marked slowing from a 3%-plus average pace in 2017-18. Amid these difficulties, the services sector held up. As we have highlighted in this report, central bankers have responded by injecting stimulus to keep the decade-long expansion going.
In the U.S., easier financial conditions did little to help manufacturers in 2019. The factory sector entered its worst slump since 2015-16 and the ISM manufacturing index declined steadily throughout the year, hitting a cycle low in December. Temporary shutdowns in the auto sector and aerospace have added to the sector’s woes, but the bigger issue last year was escalating trade tensions. A recent Fed paper analyzing U.S. import tariffs found that, in more tariff-exposed manufacturing industries, the negative effects of higher input costs and other countries’ retaliatory measures more than offset any positives from import protection. Added to this is the negative impact of trade policy uncertainty on business investment, which had knock-on effects for manufacturers via slower orders for capital goods.
The nation’s economy is becoming increasingly concentrated in large cities and by the coasts, and less so in rural counties. This leads to the question of whether rural areas will be increasingly left behind. The growing concentration of the country’s economic activity could impact a variety of things from infrastructure spending to labor mobility, but it’s unclear how rural areas will fare as their share of economic output continues to dwindle.
The anticipated USMCA ratification and a preliminary U.S.-China trade deal should resolve some of the trade concerns. On New Year’s Eve President Trump tweeted that he would sign a Phase One trade deal with China on January 15th at the White House, and that he would travel to Beijing at an unspecified later date to begin discussions on a Phase Two agreement. Phase One includes a partial rollback of tariffs imposed in September on $120 billion of Chinese goods and cancellation of those planned to implementation on December 15, 2019, mainly in exchange for higher Chinese purchases of U.S. agricultural commodities over the next two years.xix This truce should allow China’s export sector to gain momentum in 2020 although uncertainty about the path ahead will remain high.
Unfortunately, substantial tariffs remain in place and the Trump administration’s unpredictable approach to trade policy will continue to cause some firms to postpone investment plans. Uncertainty leading up to the November 2020 election could also delay some capital spending.
Section 3. Investment Outlook
Slowing Global Growth and Inverted Yield Curves Leads Us to a Stagnation Forecast for the Next Twelve Months
SOURCE: FRAME GLOBAL ASSET MANAGEMENT
Frame Global Asset Management considers these trends and factors them into our outlook for the economy in our twelve-month forward period. We look back to periods of similar economic behavior and use this information to predict the future behavior of the asset classes that we consider. Our investment process allows us to adapt for non-traditional monetary policy and other exogenous variables.
Section 4. December 2019 Portfolio Models
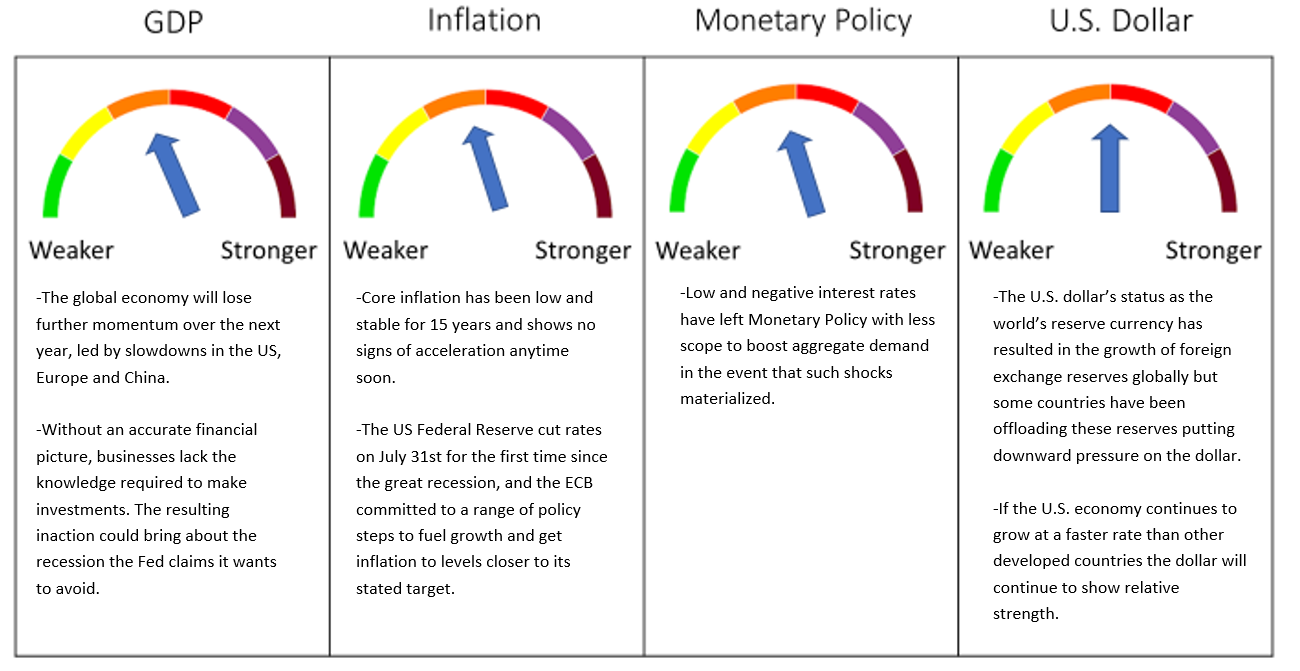
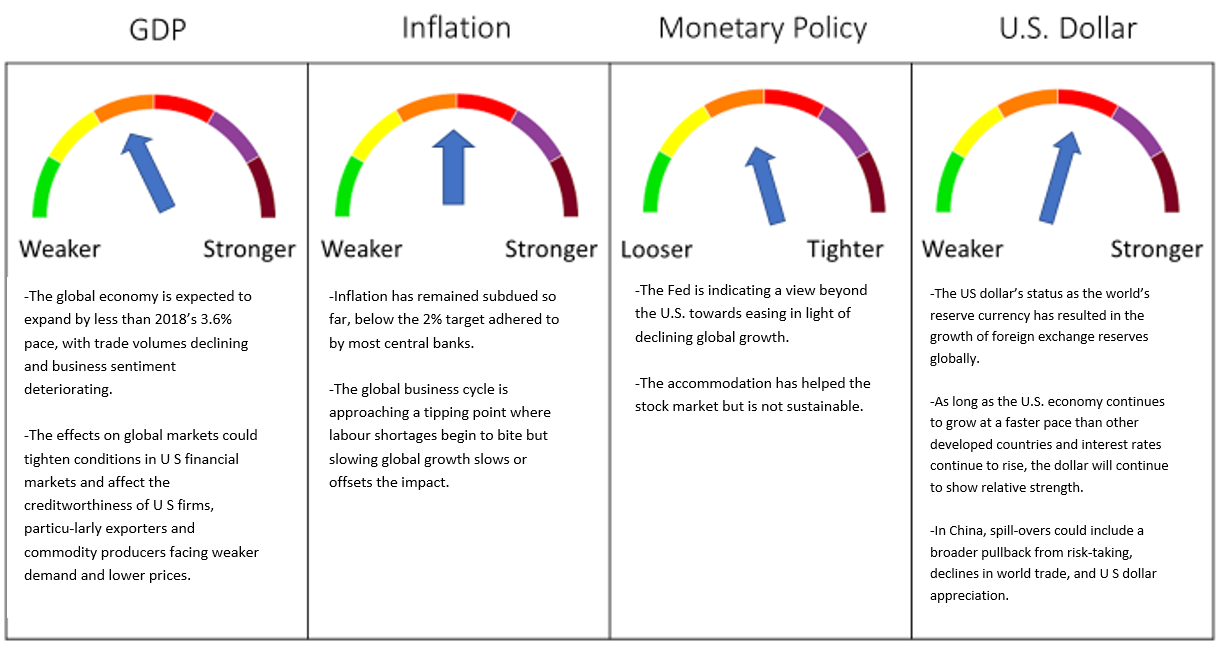
We have maintained our Stagnation outlook for the U.S. economy as growth is capped over our forecast time horizon of twelve months.
As uncertainty revs up, global GDP is on track to rise 3% in 2019, the slowest pace in a decade. Global trade volumes fell in 2019 for the first time since the Great Recession, reflecting rollercoaster U.S.-China trade negotiations, a lack of progress on Brexit, and political unrest in Hong Kong and some Latin American countries. Central bankers have responded with stimulus to keep the decade-long expansion going. While low interest rates and accommodative financial conditions will likely prolong the expansion, much will depend on geopolitical influences. We are monitoring these developments and have concluded that our Stagnation outlook for the U.S. economy over our forecast time horizon of twelve months still stands, with a recession likely in 2021.
We will continue to monitor the data for growth, inflation, and recession signals from employment, consumer spending, business sentiment, Fed policy, the yield curve, inflation, and global economics. Our focus is on protecting portfolios from downside risk, and we believe that our investment process is working to achieve that goal.
Deborah Frame, CFA, MBA
President and Chief Investment Officer
January 14, 2020
iTrading Economics. U.S. GDP. January 2020.
iiiU.S. Energy Information Administration. What Countries are the top producers and consumers of oil? January 2020.
ivU.S. Energy Information Administration. January 2020.
vNatural Resources Canada. Crude Oil Facts. January 2020.
viNatural Resources Canada. Crude Oil Facts. January 2020.
viiCastelli, Massimiliano; Salman, Philipp. (2019) Time to evolve. UBS Asset Management.
viiiCastelli, Massimiliano; Salman, Philipp. (2019) Time to evolve. UBS Asset Management.
ixCastelli, Massimiliano; Salman, Philipp. (2019) Time to evolve. UBS Asset Management.
xWorld Gold Council. Outlook 2020. Global economic trends and their impact on gold. January 2020.
xiWorld Gold Council. Outlook 2020. Global economic trends and their impact on gold. January 2020.
xiiTrading Economics. U.S. Fed Funds Rate. January 2020.
xiiiPerlaky, Adam. Recent gold and oil movements highlight inconsistent long-term correlation. World Gold Council. Goldhub blog. January 14, 2020.
xivMikulska, Anna. How Russian Oil Has The Most To Gain From Iran-U.S. Crisis. Baker Institute. January 8, 2020.
xvMikulska, Anna. How Russian Oil Has The Most To Gain From Iran-U.S. Crisis. Baker Institute. January 8, 2020.
xviMikulska, Anna. How Russian Oil Has The Most To Gain From Iran-U.S. Crisis. Baker Institute. January 8, 2020.
xviiRBC Thought Leadership. Navigating the 2020s. January 2020.
xviiiRBC Thought Leadership. Navigating the 2020s. January 2020.
xixJ.P.Morgan. Global Data Watch. January 10, 2020.