Section 1: Q3 2021 Outlook
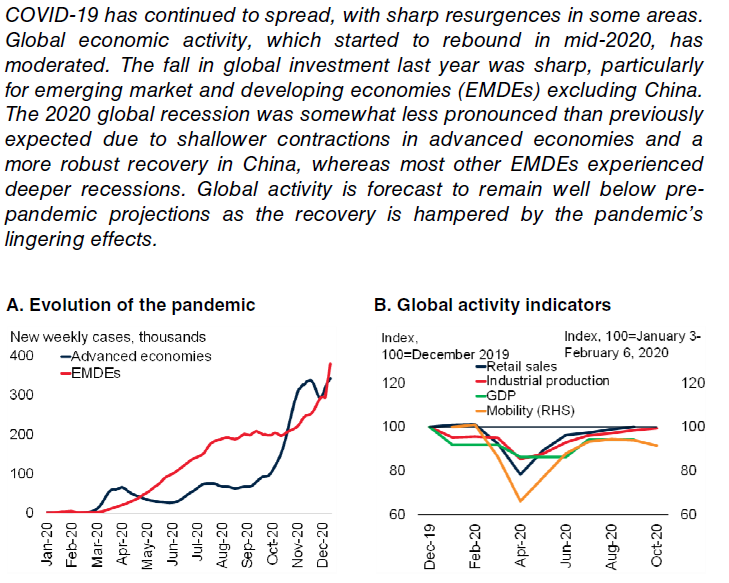
Despite the robust underlying strength in the global economy, COVID remains a threat. With the Delta variant spreading more easily, it now looks likely that global infections this quarter will push well above the second-wave peak. The recent surge in infections in high vaccination rate countries is a surprise. In the past four weeks, U.K. infections have approached their January highs and a clear upturn is also underway across Europe and the U.S. While vaccines are important for minimizing the damage, the projected surge in case counts among the unvaccinated could still overwhelm health care systems.
How Will Canada Fare in the Recovery?
In this Q3 Outlook, we are taking a closer look at Canada and the opportunities that position the country for recovery. Canadians have responded very positively to vaccine rollout and there is little sign of a new outbreak in Canada. New COVID-19 cases have trended up across the border in the U.S. in recent weeks due to the more contagious Delta variant, mostly in states with low vaccination rates. Recent data for Canada are highly encouraging as the share of the population that has received at least one dose is one of the world’s highest. The vaccination campaign has seen about 70% of the population inoculated with at least one dose and about two-thirds of Canadians fully vaccinated. The number of daily new cases is the lowest in 10 months and new cases are concentrated in younger age groups, whose vaccination rates are lower (no vaccines are authorized for those less than 12 years old).
Hospitalizations have been falling in recent weeks, allowing an easing of public-health restrictions. In addition, the government has now permitted fully vaccinated citizens and permanent residents of the U.S. currently residing in the U.S. to enter Canada beginning August 9th. Provinces are easing local restrictions gradually, and high-frequency mobility indicators from Google and Apple have trended up in recent weeks. Hurdles to overcome include vaccine resistance among some segments of the population and the persistence of COVID-19 variants that continue to pop up.
Canada Emerging from 2020
Canadian household wealth rose in 2020. Households’ net worth climbed to a record level in 2020 as government supports and price appreciation pumped up asset balances. Currency and deposit holdings increased a whopping $205 billion over 2019, the latest indication of the exceptionally large store of household savings that were accumulated over the pandemic.i
Government transfers to households increased by $117 billion.ii Mortgage debt rose by $110 billion over 2019, but house prices rose more as residential real-estate markets roared back following spring lockdowns. Net household equity in real-estate rose by a whopping $531 billion in 2020. Non-mortgage household debt (e.g., credit cards) actually declined last year with households prudently using some excess cash to carry smaller debt balances. The debt-to-income ratio remains exceptional high at 175.0% albeit still well below 2019 levels.iii
Wages and salaries fell a cumulative $36 billion through 2020 relative to pre-shock (Q4/2019) levels as unemployment spiked. Resurgent stock markets boosted end-of-year financial asset holdings by $291 billion from year-ago.iv
Canada in 2021
The Canadian economy expanded 1.4% in the first three months of 2021, slowing from a downwardly revised 2.2% rise in the previous period but still marking the 3rd consecutive quarter of growth.v Government transfers to households and businesses continued, and an improved labour market continued to support housing investment and household spending. Housing investment expanded 9.4% but rising input costs heightened construction costs. Also, household spending increased 0.7%, with the biggest increases seen for information processing equipment (+18.7%), major tools and equipment (+13.8%), and games, toys, and hobbies (+25%). On the other hand, business investment in machinery and equipment fell 2.7%, because of a sharp decline in investment in aircraft (-98.7%), as a large number of used aircraft were disposed of through international exports. Export rose 1.5% and imports 1.1%.
Second quarter growth in Canada is coming in lower than in the U.S. because of more restrictive public-health measures. The Canadian economy shrank for the first time in a year in April, contracting 0.3% month-on-month.vi Given April’s showing, economic output was 1.1% below its pre-pandemic (February 2020) level. Statistics Canada also produced a flash estimate for May GDP, which again showed a 0.3% contraction for the month. This number pales in comparison to the whopping 18% drop over March and April last year during the first virus wave.vii
Weakness was concentrated in industries impacted most by virus spread/containment measures. Virus spread and re-imposed containment measures in ‘high-contact’ service-sectors pushed accommodation and food services sales down 4.6% from March. Retail sales also pulled back with stores either closed or operating at reduced capacity but remained about 2% above pre-shock (February 2020) levels. Manufacturing output dropped 1% with a shortage of semiconductor chips pushing motor vehicle production down over 20%. But construction spending increased, and mining output continued to surge alongside high commodity prices.viii
As we begin to recover, Canadians are poised to quickly deploy spending as the economy gradually reopens. June output is expected to look better as the economy opened up further and with vaccine distribution continuing to ramp up, the hope remains that this time the reopening will be more sustainable. The Canadian economy has already recovered nearly 80% of the jobs lost during the recession last year. That said, there are still a large number of Canadians unemployed – the unemployment rate was 8.2% in May, falling to 7.8% in June.ix As is apparent in many economies, jobs for lower income Canadians remain well below pre-pandemic levels. Fortunately, many Canadians have built up their savings over the past 14 to 15 months due to their inability to spend on services like travel and meals out.
A Closer Look at The Oil and Gas and Mining Sectors in Canada
As Canada moves towards a recovery, commodity demand and pricing will have a significant impact on Canada’s growth, relative to non- resource-based economies.
The Canadian Energy Industry
• Canada’s energy sector accounts for over 10% of nominal Gross Domestic Product (GDP).
• Government revenues from energy were $17.9 billion in 2018.
• Canada is the sixth largest energy producer, the fourth largest net exporter, and the eighth largest consumer.
• In 2019, Canada’s energy sector directly employed more than 282,000 people and indirectly supported over 550,500 jobs.x
Fed policy is important to the global economic recovery and capital flows but is secondary to global fundamentals in oil markets. Oil prices have climbed nearly 50% this year as key economies such as the U.S., U.K., and China have reopened, buoyed by mass vaccination campaigns. Crude stockpiles in China, the world’s biggest importer of crude, have dwindled to the lowest this year. As India emerges from a deadly coronavirus surge, an uptick in local fuel consumption has prompted the nation’s biggest refiner to boost production. Re-opening of major economies will boost refined-product demand in oil markets – e.g., gasoline and jet fuel – going forward, which will leave refiners little choice but to continue drawing on inventories to cover supply shortfalls in the near term.
While the forecasted rebound in global oil demand continues to drive expectations for higher prices, it is the production discipline of OPEC 2.0 and capital discipline imposed on U.S. shale producers that has and will continue to super-charge the recovery of prices. In July, the OPEC+ group reached an agreement to increase production by 400,000 barrels per day each month over the balance of 2021 as well as extend the cooperation agreement until the end of 2022. The group has agreed to higher reference production levels for all members, including the recalcitrant UAE. The group will meet again in September. We believe the agreement is in line with market expectations and that rising demand should absorb the planned increase in production.
OPEC 2.0 remains committed to its production management strategy that is keeping the level of supply below demand. Compliance with production cuts in May reportedly was at 115%, following a 114% rate in April. Core OPEC 2.0 – i.e., states with the capacity to increase production – is holding close to 7 million barrels per day of spare capacity, according to the IEA, which will allow it to continue to perform its role as the dominant supplier in our modeling. Earlier this year, KSA’s Energy Minister Abdulaziz bin Salman correctly recognized the turn in the market that likely ensures OPEC 2.0’s dominance for the foreseeable future including the shift in focus of the U.S. shale-oil producers from production for the sake of production to profitability. This is a trend that has been apparent for years as capital markets all but abandoned U.S. shale oil producers.
Producers outside OPEC 2.0, the “price-taking cohort”, have prioritized shareholder interests as a result of this market pressure. Large producers are expected to shed production assets to reduce their carbon footprints, so as to come into compliance with court-ordered emission reductions and shareholder demands to reduce pollution. With the oil majors like Shell, Equinor, and Oxy already divesting themselves of shale properties, production increasingly will be in the hands of firms driven by profitability.xi
Income Drives Oil Demand
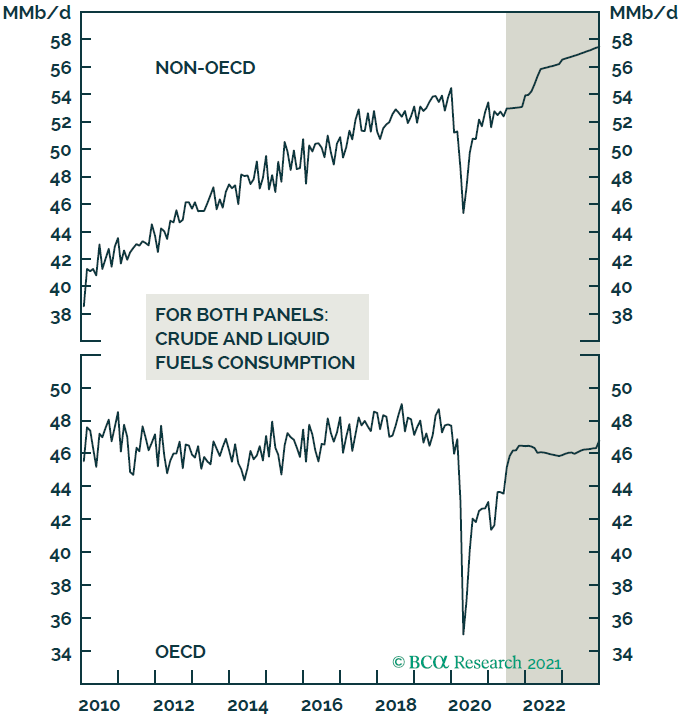
NOTE: SHADED AREA DENOTES FORECAST.
SOURCE: US EIA, OPEC, IMF, BCA RESEARCH.
The Canadian Mining Sector
• In 2019, Canada’s mining sector contributed $109 Billion, or 5%, of Canada’s total nominal GDP.
• Canada ranks among the top five countries in the global production of 17 minerals and metals.
• Valued at $106 billion in 2018, mineral exports accounted for 19% of Canada’s total domestic exports.
• The industry’s direct and indirect employment accounts for 719,000 jobs, accounting for one in every 26 jobs in Canada.
• Proportionally, the mining industry is the largest heavy industrial employer of Indigenous peoples and provided over 16,500 jobs to community members.xii
Copper and aluminum will remain well bid in the face of constrained supply and higher consumption ex-China. Despite China’s widely anticipated decision to release strategic stockpiles of copper, aluminum, and zinc next month into a tight domestic market, continued inventory draws will be required to cover physical deficits in these markets, particularly in copper.
As demand for industrial commodities increases and inventories continue to draw, forward curves will become more backwardated as material delivered promptly (next day or next week) will command a higher price than commodities delivered next month or next year. Consumers value current supply above deferred supply, and producers and merchants must charge more to cover inventory replacement costs, which increase when prompt demand outstrips supply.
Will Rising Resource Prices Lead to Inflation in Canada and Abroad?
Canada’s headline inflation rate was the highest in a decade in May. Headline CPI rose 3.6% year-over-year in May, 2.4% excluding food and energy components. Higher costs for homeowner replacement and passenger vehicles supported rise in core prices.xiii
Headline inflation rose 3.6% from a year ago in May, the highest in a decade. Energy prices were up 26.4% from exceptionally low year-ago levels and accounted for almost half of the increase, despite moderating slightly from April’s 32.7%. Growth for food prices rose 1.5% from already-strong levels last May and will probably continue to grind higher on the back of elevated agriculture commodity prices. Outside of food and energy, prices rose 2.4% from May 2020, faster than April’s 1.8% pace. Still, price growth has been increasingly broadly based. 58% of goods and services in the consumer index basket were up 2% or more (on a 3-month rolling average basis) in May, up from 54% in April and well-above the 40% trough in September 2020. The Bank of Canada’s preferred ‘core’ measures all increased again in May. There have been some early signs of easing in some of the supply chain disruptions that sent industrial production input costs soaring. Raw lumber prices, for example, have moderated sharply in recent weeks (albeit to still elevated levels.) But consumer demand is set to surge as the economy reopens, and that demand, particularly for purchases of services, is expected to take over as a key driver of price growth in the second half of 2021.xiv
In the U.S., inflation has been much higher. Three months to May core inflation reached 8.3% on an annualized basis, the highest rate since the early 1980s. In June the Institute for Supply Management’s index of changes in the prices paid by American manufacturers registered its highest reading since 1979, a year in which consumer prices rose by 13.3%. Inflation in other rich countries has been more modest. But it has still exceeded expectations. In the Euro area headline inflation year-over-year has risen from 0.9% to 1.9% since May, touching the European Central Bank’s target of “below, but close to 2%”.xv
Much of this is due to base effects; core consumer prices fell between February and May, as they did in Japan. Britain is an intermediate case. Headline inflation is roughly on target, but core consumer prices have accelerated. This is not just an issue for rich countries. A measure of aggregate inflation in emerging markets produced by Capital Economics, a consultancy, rose from 3.9% in April to 4.5% in May. Rising inflation has set off a cycle of monetary tightening. Since the start of June, central banks in Brazil, Hungary, Mexico, and Russia have raised rates.xvi
Has the Pandemic Enhanced Structural Changes to Inflation?
Many of the structural factors that have suppressed inflation over the past 40 years are reversing direction. Globalization is in retreat; the ratio of global trade-to-manufacturing output has been flat for over a decade. Looking out, the ratio could even decline as more companies shift production back home to gain greater control over unruly global supply chains.
Despite a pandemic-induced bounce, underlying productivity growth remains disappointing. Slow productivity growth could cause aggregate supply to fall short of aggregate demand.
Short- and Long-Term Inflation Factors
In the short term, the factors pushing inflation higher are threefold. The first is a boom in demand for goods like cars, furniture, and household appliances set off by consumers splurging on things that made lockdown homes nicer and life outdoors more enjoyable. The second is disruption in the global supply of some of those goods. A shortage of microchips, for example, is severely curtailing the supply of cars. A higher oil price does not help. Disruption in the global shipping industry and at ports exacerbates things in various markets. The third—probably the most important, and the one only now fully coming to be felt—is a rebound in the prices of services. Consumers are returning to restaurants, bars, hairdressers, and other in-person businesses faster than workers are.
A sustained rebound in inflation would be bad news for two reasons:
1) Inflation hurts. Life-satisfaction surveys carried out in the 1970s and 1980s found a one-percentage-point rise in inflation reduced average happiness about as much as a 0.6-percentage-point rise in the unemployment rate. If it catches workers by surprise, it erodes their wages, hurting the lowest paid the most; if it catches central banks by surprise, they may have to slow the economy, or even engineer a recession, to put the beast back in its cage.
2) Inflation has the potential to up-end asset markets. The sky-high prices of stocks, bonds, houses, and even cryptocurrency rests on the assumption that interest rates will stay low for a long time. That assumption makes sense only if central banks do not feel forced to raise them to fight inflation. If prices rise too persistently, the financial edifice that has been built on years of low inflation could lose its foundations.
Inflation Threats Within Our One Year Time Horizon
In the U.S., 27% of the index is skewed by the re-opening trade and supply chain issues and the other 73% was not distorted by the pandemic. In Canada, the spike in May’s CPI – up 0.5% month over month – lifted the year over year pace to a decade-high of 3.6% from 3.4% in April. As was the case in the U.S., 27% of the index was skewed by the re-opening trade and supply chain issues while the other 73% was not distorted by the pandemic. The segment of the CPI (auto purchases and leases, home improvement, furniture/appliances, recreational services and the like) that is COVID-19-skewed saw prices soar 1.8% in May; the 73% share not being distorted was basically flat (+0.1%).xvii
Rising energy and commodity prices, production bottlenecks due to the shortage of some input components, and raw materials and capacity constraints vis-à-vis booming demand both at home and abroad are expected to put upward pressure on consumer prices this year.
Our Long- Term Inflation Outlook
• Outside of a few industries, wage inflation remains well contained. In those industries suffering from labor shortages, the expiration of emergency unemployment benefits, increased immigration, and the opening of schools should replenish labor supply.
• Bottlenecks in the global supply chain are starting to ease. Many key input prices have already rolled over, suggesting that producer price inflation has peaked and is heading down.
• A slowdown in Chinese credit growth could weigh on metals prices during the summer months, which would further temper inflationary pressures.
In 2022, we expect pressures to moderate gradually as supply constraints resolve, order backlogs clear, and demand growth moderates. The likely path of U.S. yields is central to a debate currently influencing markets: whether the signs of accelerating inflation around the world are transitory or more lasting, and how central banks will respond to price pressures during a post-Covid economic rebound. We continue to see high global inflation as a long-term risk rather than a short-term problem.
Section 2: Three Themes
Theme 1: The U.S. Economy is Recovering but is Subject to Setbacks
After an expansion of 6.4% annualized in the first quarter of the year, Q2 is expected to be stronger. As in recent months, household spending is likely to be the main driver. Business investment should also contribute to growth. Residential investment, meanwhile, could be set for a pause after several months of strength. It will take more time for the upside effects of reopening to be fully reflected in the labour market numbers.
Back in March, the Fed projected no hikes until 2024. The Fed jolted markets on June 16th after the FOMC signaled it may raise rates twice in 2023. The Federal Reserve began closing the door on its pandemic-driven monetary policy as officials projected an accelerated timetable for interest rate increases, opened talks on how to end crisis-era bond-buying, and said the 15-month-old health emergency was no longer a core constraint on U.S. commerce.
Signaling that broad changes in policy may happen sooner than expected, U.S. central bank officials moved their first projected rate increases from 2024 into 2023, with 13 of 18 policymakers foreseeing a “liftoff” in borrowing costs that year and 11 seeing two quarter-percentage-point rate increases.xviii A flattening in the yield curve that has continued since the fed announcement is a market signal of slower economic growth ahead.
Theme 2: China is Cooling
China’s economy, well-placed to benefit from strong international demand for merchandise, recovered rapidly from the initial shock of Covid-19. It is the only large economy that expanded in 2020. As the rest of the world is recovering from the pandemic, China has struggled with additional waves that have resulted in rolling shutdowns in primary industries.
Chinese credit growth and base metals prices are strongly correlated. Chinese authorities are not expected to embark on a new deleveraging campaign. Credit growth has already fallen back to 11%, which is close to the prior bottom reached in late-2018. To the extent that changes in Chinese credit growth affect commodity prices with a lag of about six months, metals prices could struggle over the summer months. China’s plan to release metal reserves into the market could further dampen prices.
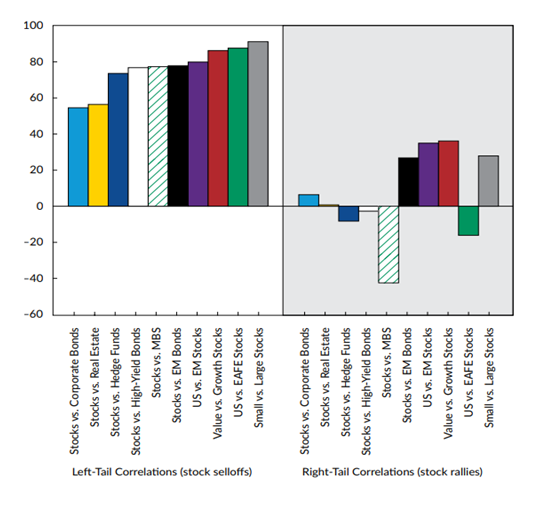
Theme 3: Gold Continues to Be a Portfolio Stabilizer
Gold is sensitive to Fed policy and forward guidance. Its price will continue to be volatile as the widening dispersion of views evident in the Fed dots keeps markets on edge and pushes forward rate expectations in different directions.
Gold volatility will also remain elevated as markets factor in oil price volatility that will increase with steeper backwardation and base metals volatility that will rise as fundamentals continue to tighten.
Section 3. Investment Outlook
Global Pandemic Leads Us to a Growth Forecast for the Next Three Months Followed by Nine Months of Stagnation
SOURCE: FRAME GLOBAL ASSET MANAGEMENT
Frame Global Asset Management considers these trends and factors them into our outlook for the economy in our twelve-month forward period. We look back to periods of similar economic behavior and use this information to predict the future behavior of the asset classes that we consider. Our investment process allows us to adapt for non-traditional monetary policy and other exogenous variables.
Section 4. June 2021 Portfolio Models
The macroeconomic environment was a key focus in May. Massive fiscal support has been the glue that has held the economy together but the re-opening contribution to growth is for the most part completed. The question of whether the change in consumer prices is transitory or a regime shift will determine the sustainability of economic growth. We have maintained our economic outlook of three months of Growth followed by Stagnation for the remainder of our twelve-month forecast horizon.
In June, we maintained the asset allocation we established in May. Equity exposure across all models reflects our view that markets are looking through the uncertainty of the pandemic and towards the resumption of more normal life once populations are vaccinated. The recent shift in the bond-equity correlation into positive territory appears to be a function of the persistency in inflation. Fiscal spending that funds local governments supports our exposure to treasuries and municipal bond exposure in the U.S. We continue to include exposure to gold as a portfolio stabilizer.
The economic reopening and the global stimulus that is underway will lead to improved household liquidity, healthy consumer balance sheets, and a healing labor market.
Deborah Frame, CFA, MBA
President and Chief Investment Officer
July 14, 2021
iTrading Economics. Canadian Household Wealth, Credit Market Debt to Total Income. June 2021.
iiTrading Economics. Canadian Government Spending. June 2021.
iiiTrading Economics. Canadian Household Wealth, Credit Market Debt to Total Income. June 2021.
ivTrading Economics. Canada Hourly Average Wages. June 2021.
vTrading Economics. Canada GDP Growth Rate. June 1, 2021.
viTrading Economics. Canada GDP Growth Rate. June 1, 2021.
viiTrading Economics. Canada GDP Growth Rate. June 1, 2021.
viiiTrading Economics. Canada GDP Growth Rate. June 1, 2021.
ixTrading Economics. Canada Unemployment Rate. July 9, 2021.
xStatistics Canada. Canadian Energy Data. June 2021.
xiBank Credit Analyst. June 17, 2021.
xiiStatistics Canada. Canadian Mining Data, Natural Resources Canada. June 2021.
xiiiTrading Economics. Canada Inflation Rate. July 28, 2021.
xivTrading Economics. Canada Inflation Rate. July 28, 2021.
xvThe Economist. July 11, 2021.
xviCapital Economics. June 2021.
xviiTrading Economics. Canada Inflation Rate. July 28, 2021.
xviiiThe U.S. Federal Reserve System. June 16, 2021.