Section 1: Q2 2020 Outlook
Global Risk: The World Is Heading for the Sharpest and Deepest Global Slowdown Since WW2
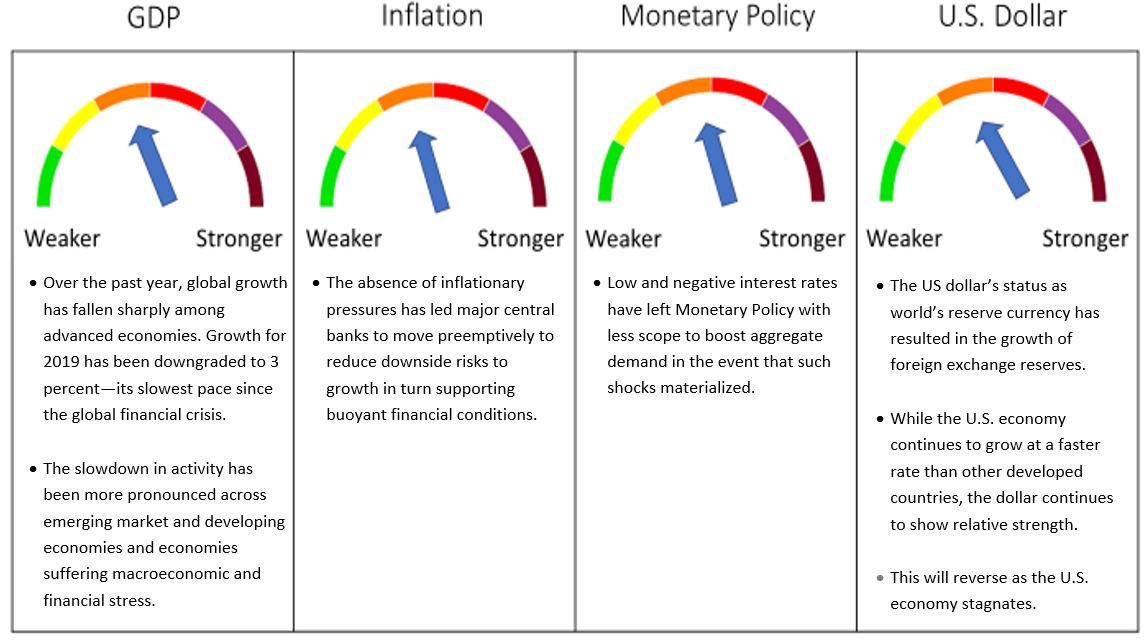
The economic cost of the COVID-19 crisis may pale in comparison to the human cost. Many people fear for their own health and that of their loved ones. As such, there is a “real” element to the fear factor. Measures to contain the virus have upended supply chains and financial markets and weighed on commodity prices. Consumer and business confidence is expected to remain subdued for some time, not least if fears of a second wave of the virus linger. Given the hit to both the services and goods-producing sectors, the International Monetary Fund (IMF) expects real GDP to contract at a greater than 30% annualized pace in the current quarter.i
This shutdown will cause the greatest short-term drop in output that the global economy has ever experienced, and the pace of the subsequent recovery is hard to determine at this time. No one knows how long the supply and demand disruptions will constrain growth.
Markets are looking for confidence in the policy response. Policy must ensure that households, businesses, and the financial system remain liquid. Policy should also aim to minimize damage to the solvency of all stakeholders, preventing sharp drops in business and household cash-flow positions from triggering a wave of bankruptcies in the real economy and of margin calls in the financial system.
Containment and Stabilization Followed by Recovery
With lockdowns in place across much of the world, the IMF has downgraded their forecasts further in recent days, now forecasting global real GDP to fall by over 3% this year.ii That compares with a pre-virus forecast assuming growth of about 3%. This means that 2020 is set to be the worst year for the global economy since the end of the Second World War, when world GDP in 1945 plunged by 5.5%. Most of the output lost in the first half of this year will probably be lost forever and it could take years for demand to recover completely. Demand for travel abroad may stay weak for months and possibly years. Secular stagnation forces, political uncertainty, and empty monetary toolkits indicate that rapid recovery is not possible even after the virus-related supply and demand disruptions have faded. Firms will be considering how to repay their emergency loans, while in some countries there might be the prospect of a new wave of austerity to repay the rise in public debt. Early signs from China are that demand has been slow to return despite firms being told to resume normal operations in February.
This crisis will need to be dealt with in two phases: a phase of containment and stabilization followed by the recovery phase. In both phases public health and economic policies have crucial roles to play. Quarantines, lockdowns, and social distancing are all critical for slowing transmission, giving the health care system time to handle the surge in demand for its services and buying time for researchers to try to develop therapies and a vaccine. These measures can help avoid an even more severe and protracted slump in activity and set the stage for economic recovery.
The new policy mix will require that fiscal policy be used to attain full employment and price stability, while monetary policy will be used to ensure debt sustainability by keeping sovereign yields low. As well as going all-out in its role as lender of last resort, central banks will be required to do the same for the financial system.
So far, the fiscal response in affected countries has been swift and sizable in many advanced economies including Australia, France, Germany, Italy, Japan, Spain, the United Kingdom, and the United States. Many emerging market and developing economies, such as China, Indonesia, and South Africa have also begun providing or announc¬ing significant fiscal support to heavily impacted sectors and workers. Fiscal measures will need to be scaled up if the stoppages to economic activity are persistent, or the pickup in activity as restrictions are lifted is too weak.iii
Globally, central banks’ response to the coronavirus crisis has been unprecedented and is likely to change the way that financial markets function for years to come. Countries are starting out with very different fiscal positions. Central banks’ balance sheets will be far larger and contain a much wider variety of assets than before as a result. Germany currently enjoys a budget surplus and has plenty of fiscal capacity, and China is now pumping in substantial support.
The Fed has launched many new programs. The U.S. was on track for an outright fiscal drag in 2020 due to expiring stimulus, living with the largest fiscal deficit and thus is the least capable of delivering more fiscal stimulus. Now the Fed is giving the Treasury access to its printing press. This means that, in the extreme, the administration is free to use its control, to instruct the Fed to print more money so it can buy securities and hand out loans in an effort to ramp financial markets higher. The case for central-bank independence has gone largely unquestioned for years. Logic assumed that politicians think short-term and make decisions for political reasons. At full or close-to-full employment, expansionary monetary policy might briefly juice the economy but, after a delay, create inflation. When monetary policy is kept at arm’s length from politics by making it the responsibility of an independent central bank, you avoid the problem. This logic is now being put to the test.
The Fed’s actions can be split into three main categories. First, it has acted as a “buyer of last resort” in many markets. This covers its open-ended purchases of Treasuries and mortgage-backed securities (MBS), including agency commercial MBS. It also covers its purchases of commercial paper, corporate bonds, and municipal bonds. Though the aim is different, the Fed will also purchase so-called “Main Street” loans. Second, it has lent against all kinds of collateral, either to support key parts of the financial system, or to encourage more lending by other institutions. The Money Market Mutual Fund Liquidity Facility and Primary Dealer Credit Facility are examples of the former. The Term Asset-Backed Securities Loan Facility is an example of the latter. That facility lends against asset-backed securities (whose underlying exposure is to a wide variety of loans including auto loans and leveraged loans), aiming to boost issuance. Third, it has acted to limit financial distress outside the U.S., and the associated upward pressure on its currency, by making cheap dollar funding readily available. This covers the Fed’s revived and expanded swap lines, plus its new Foreign and International Monetary Authority (FIMA) repo facility.iv
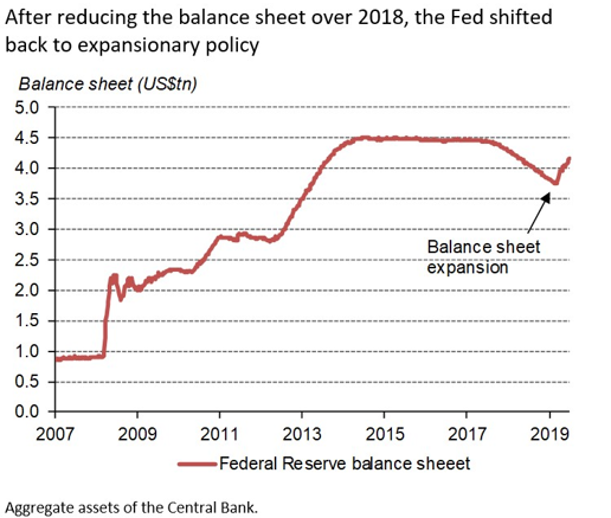
The Federal Reserve has now expanded its balance sheet beyond $6 trillion, an increase of almost $2 trillion in less than a month. It has taken extraordinary steps to lift regulations to help banks play their part in the relief effort. One consequence may be that central bank support could help most risky assets to outperform safe ones by a wide margin as these measures go far beyond conventional monetary easing in their efforts to backstop the financial system.v With a policy interest rate that has been cut to a range of 0% to 0.25% and commitment that rates would stay low indefinitely, the supply of funds outside of the Feds own money creation may become scarce. By virtue of a system that promotes superior productivity growth, the country’s knack for nurturing world-beating companies, and less challenging demographics than the developed world, there is some hope that the U.S. can outpace most of the developed world in economic recovery.
Controlling Our Own Behavior it the Middle of a Pandemic
In the middle of this global pandemic, we consider what we can and cannot control. This applies not only to our individual behavior, but also when it comes to our investment positioning.
In theory, being prepared for a low-probability, high-consequence event such as a pandemic is possible. Identify threats. Consider how to mitigate. Weigh costs of mitigation against probability and consequence, factoring in available resources and competing demands. Prepare.
An economist describes loss aversion as when an individual’s utility is concave over gains and convex over losses. This means that a gain contributes less to utility/happiness than an equal dollar loss subtracts from utility/happiness. The current economic meltdown presents us with the reality that when a capital loss is suffered, ability to recover the same amount that was lost must be done from a lower base, requiring a larger percent recovery just to break even. This pain is not imagined, it is very real (see our White Paper at www.frameglobal.com/education). Avoiding losses in the first place is much preferred to recovering from losses.
We Put Economic Theory into Practice and Have Been Rewarded
Frame Global Asset Management considers the outlook for the global economy relative to a view of expected U.S. GDP growth in the twelve months ahead. We track asset class behavior over time, both in terms of returns – gains and losses – and correlations to other asset classes. When historic data for asset classes is partitioned under broad macro-economic environments, patterns of behavior become obvious. The outlook falls into one of the following five broad descriptions: GROWTH, STAGNATION, RECESSION, INFLATION, or CHAOS, allowing for a transitioning in the period from one environment to another. Macro-economic environments contribute to asset class return distributions. As an economic cycle progresses through different economic environments, including Chaos and Recession, we know that asset classes experience a large distribution of returns, calculated over the measurement period.
Along with consideration of greater downside risk to asset classes from periodic extreme unexpected negative events, we incorporate this information to create tactical asset allocation portfolio models, delivered with an optimal combination of broad asset class exposure.
Expected Asset Class Behavior in Recession
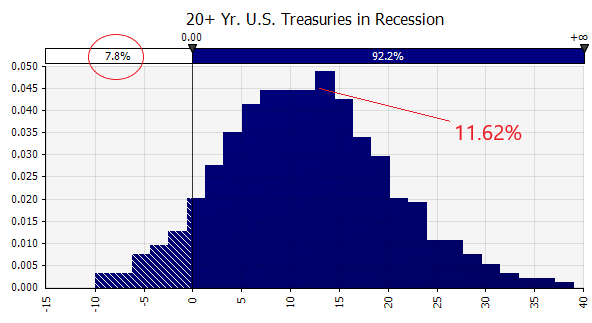
Using a statistical sampling technique called bootstrapping, we can see that in a Recession Environment, U.S. Treasuries are expected to experience losses only 7.8% of the time and earn an average return of 11.62%.
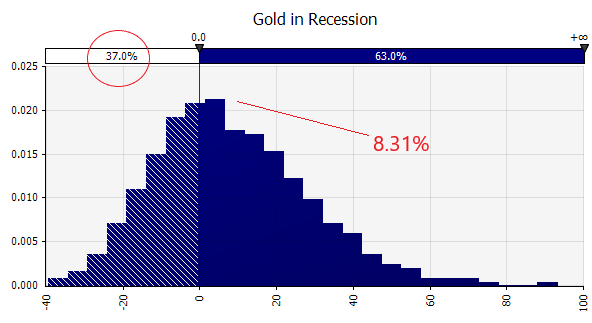
Gold is expected to experience losses 37% of the time and earn an average return of 8.31%.
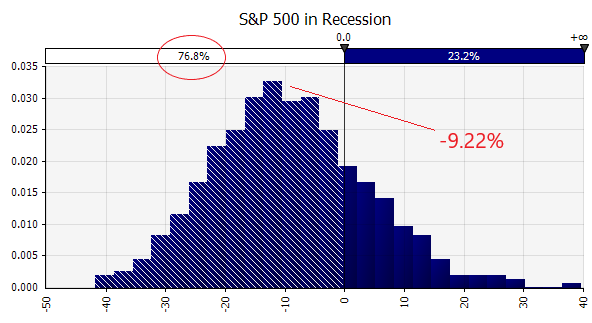
The S&P 500 is expected to experience losses 76% of the time and earn an average return of negative 9.2%.
SOURCE: FRAME GLOBAL ASSET MANAGEMENT
We Positioned for Recession in February and Avoided Losses in the First Quarter in our Conservative and Moderate Growth Portfolio Models
We define the economic environment “Chaos” as a high impact, low probability event. In a Chaos environment, all asset classes become highly correlated and suffer simultaneous losses. In this environment, we look for asset classes that will be expected to experience low correlations as we move out of Chaos and typically into Recession. There is no question that the current pandemic event has had high impact. The low probability was considered low in the broader markets and economies up until February 19th, 2020, the peak of the S&P Dow Jones. But there were indications coming from China about the virility of the virus and the high mortality rate beginning in January. Without complete cessation of all movement of people across boarders at that time, we determined that it was inevitable that the virus would spread globally.
In our Portfolio Updates we highlighted the following:
January 20th, 2020:
“The trend towards populism and protectionist policy remains a risk to the stability of global financial markets while heightened geopolitical strains also have the potential to create volatility.”
“We are monitoring these developments and have concluded that our Stagnation outlook for the U.S. economy over our forecast time horizon of twelve months still stands, with a recession likely in 2021.”
February 19th, 2020:
“The coronavirus outbreak in China has generated economic waves that are disrupting global supply networks that act as the backbone of the global economy and comes as the global economy was already cooling off.”
“In February, we reduced exposure to U.S. equities across all models and reintroduced the U.S. long-term Treasury Bond. This reflects our view on deflationary influences that dominate the global economy.”
“The trend towards populism and protectionist policy remains a risk to the stability of global financial markets and the COVID-19 outbreak is likely to delay recovery and intensify disinflation.”
March 17th, 2020:
“A global recession in 2020 is all but confirmed as nations shut down economic activity to limit the spread of COVID-19. The virus is unique in that it is a demand shock and supply shock, and also a negative wealth, oil price, and credit shock. There will be a wide range of subsequent effects. We are monitoring these developments and have updated our previous Stagnation followed by Recession outlook for the U.S. economy to reflect a Recession in March, extending through to the end of the year, as the situation will deteriorate further before beginning to recover.”
Because the market is forward looking, a Chaos environment is typically short lived and followed by a Recession. We are now positioned for Recession for the twelve- month period ahead.
Section 2. Four Themes
Theme 1: The Entire Global Economy is in Recession
The Great Lockdown is projected to shrink global growth dramatically. A partial recovery is projected for 2021, with above trend growth rates, but GDP will remain below the pre-virus trend, with considerable uncertainty about the strength of the rebound.
Global growth is projected at -3.0% in 2020, an outcome far worse than during the 2009 global financial crisis. The growth forecast is marked down by more than 6 percentage points relative to the October 2019 IMF and January 2020 IMF Update projections – an extraordinary revision over such a short period of time.vi
Recent economic reports helped fill in the picture of what happened to the economy in March and early April, and it is clear that the spread of COVID-19 led to a sharp contraction across much of the U.S. and other major economies. With the shutdown in China occurring in January, imports into the U.S. plunged in February, while exports had yet to be affected. With large parts of the U.S. domestic economy now closed, import demand will contract sharply over the coming months. Export demand so far appears to have held up much better, but widespread factory shutdowns means export volumes are likely to contract too.
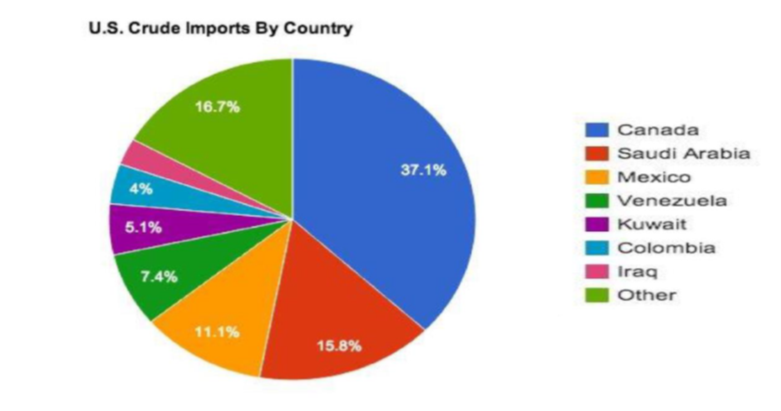
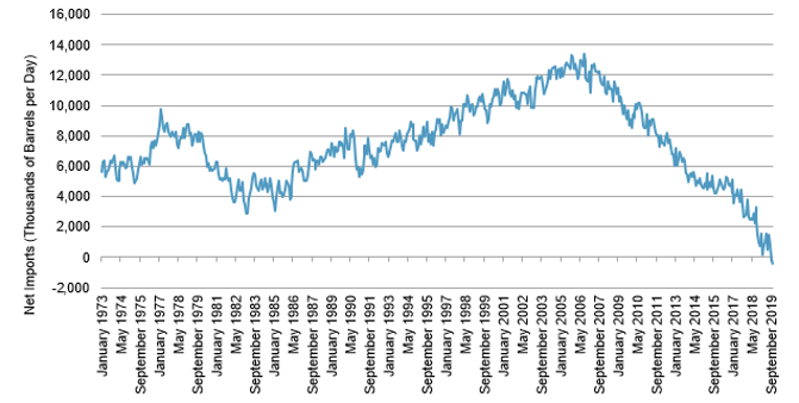
The U.S. trade deficit will narrow in the next few months but should reverse over the rest of the year, as the stronger dollar weighs more on exports. With oil production dropping sharply, the U.S. is likely to return to being a net oil importer once gasoline demand recovers.vii
Canada will rack up debt faster in this crisis than any other developed country, relative to its economy, according to data from the IMF. It is fortunate that Canada’s governments went into this economic crisis in a much better financial position than most other developed countries. Net government debt (total government debt minus its cash holdings) was at 40% of economic output before the crisis. The average for developed countries was 107%. This may be why Canada’s governments have proven more willing to spend their way out of the crisis than some others.viii
Big-time fiscal deterioration in Canada
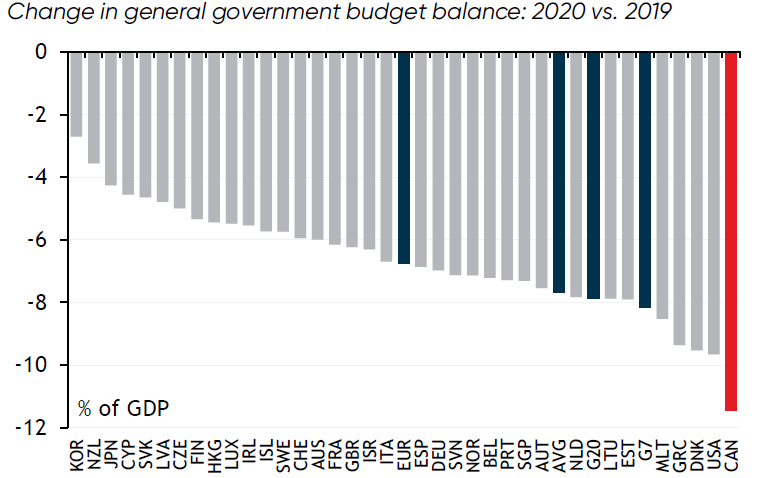
SOURCE: NATIONAL BANK FINANCIAL, IMF
NOTE: EUR = EURO AREA. COUNTRY AGGREGATES SHADED BLUE, CANADA RED.
Theme 2: Gold is a Safe Haven
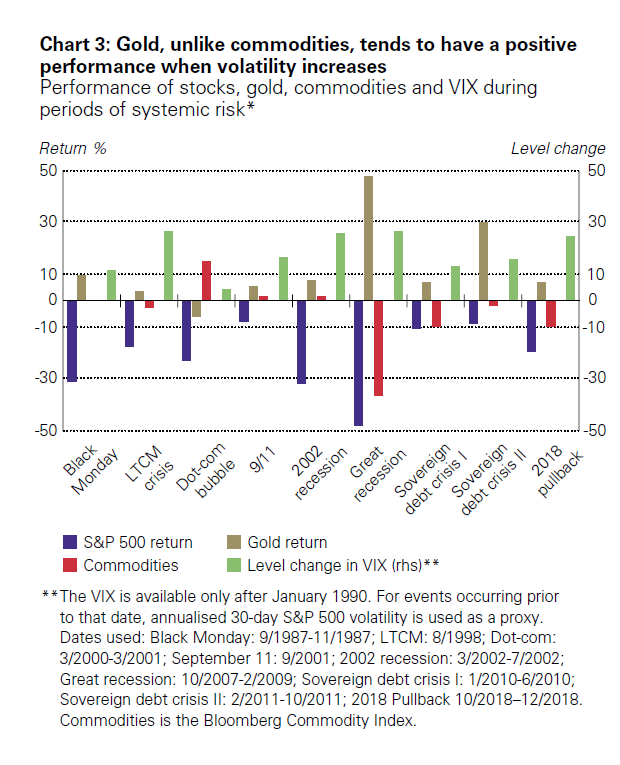
Gold has played an important role in portfolios as a source of liquidity and collateral. Like most asset classes, gold is being affected by the unprecedented economic and financial market conditions in play around the globe. Recent volatility in the gold price has been driven by massive liquidations across all assets, and likely magnified by leveraged positions and rule-based trading.
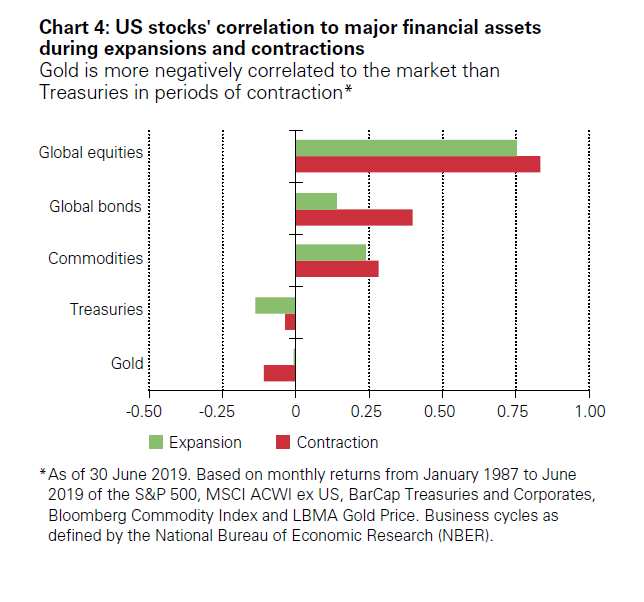
Gold has also likely been used to raise cash to cover losses in other asset classes because it remains one of the best performing asset classes year-to-date, despite recent fluctuations, and it is a high quality and highly liquid asset. But coming out of the market selloff we have seen that the stronger the pullback in the stock market, the more negatively correlated gold becomes with the market, highlighting its effectiveness in a sustained pullback (see graph below).
Gold prices denominated in many other currencies, however, continued to reach all-time highs. This highlights a continued trend of growth in gold ETFs outside of the U.S. over the past few years; a trend underscored by European funds seeing the largest absolute inflows and Asia and other regions registering the largest percentage growth during the month. It serves as a safe haven in the longer term.ix
Correlation increased across all major asset classes except three-month Treasuries during the COVID-19 selloff
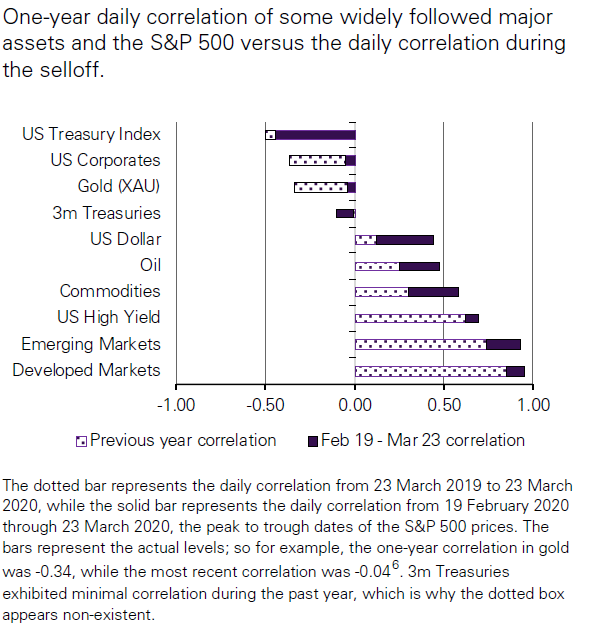
SOURCE: WORLD GOLD COUNCIL, BLOOMBERG
Theme 3: Oil Prices and Geopolitical Risk
Demand for oil has been hit by the coronavirus pandemic while global storage facilities are overflowing. International and domestic travel restrictions throughout the world and a sharp reduction in road traffic are expected to lead to a further decline in oil demand in 2020 that could exceed 10 million barrels a day, about 10 percent of global daily oil production.x
Confronting a weak demand environment, the OPEC+ coalition broke down on March 6th, 2020, leading to the worst one-day price drop in the oil market since 1991. This was repeated on April 21st. Oil prices had already declined 7.3% between August 2019 and February 2020, falling from $57.60 to $53.40, before further declining by 39.6% in March to $32.30 as the COVID-19 outbreak abruptly reversed a positive trend as containment measures directly hit the transportation sector, which accounts for more than 60% of oil demand.
After trading close to $20 toward the end of March, oil prices recovered somewhat in early April as the OPEC+ coalition resumed talks, but by mid-April the price of American crude oil crashed by more than a fifth, falling below $15 a barrel to its lowest point in two decades. The slump came even as OPEC producers and their allies have promised to slash production.xi
The drop in oil prices has already had a marked impact on Canada’s dollar. Canada’s currency is likely to remain around 70 US cents in the near term as uncertainty about the depth and duration of the crisis sees investors gravitate to the safety of US dollars.
Theme 4: Global Currency Revaluation
Every recession, financial crisis or geopolitical shock has left a permanent imprint on at least one major asset class. COVID-19’s aftermath is expected to involve at least one regime change. (See Frame Global Asset Management White Paper 3).
The currencies of commodity exporters with flexible exchange rates among emerging market and advanced economies have depreciated sharply since the beginning of the year, while the US dollar has appreciated by some 8.5% in real effective terms as of April 3rd, the yen by about 5%, and the euro by some 3%.xii The broad dollar will continue to be supported by the ongoing deleveraging demand and will maintain a bid against Emerging Market currencies where there are balance sheet vulnerabilities, and Petro currencies which will continue to suffer from the oil supply glut.
While the COVID-19 shock is depressing both global demand and supply, a demand shock this large will probably produce the first negative year-on-year readings on global CPI inflation in several decades. This decline is not just an energy price effect: global core inflation could drop below 1% for the first time in at least 20 years, which will sustain central bank concerns of deflation even once the expansion materializes.
Longer term implications, given the scale of the Fed’s purchases of Treasury securities in the first few weeks of the pandemic and the size of the broader expansion in its balance sheet, suggest that the Fed is monetizing the deficit. The monetary base expansion will eventually trigger a corresponding rise in broad money and consequently, when the economy’s resources are fully utilized again, the prices of goods and services too.
The revenue loss around a recession results with the contraction in aggregate demand. Margin compression is by far the biggest contributor to profit losses in a recession. Margins are driven by many factors, but the three most important are: prices (a positive), wages (a negative), and productivity (a positive). Roughly two-thirds of the variation in global corporate profit growth can be explained by the difference between price inflation and growth in unit labor costs (that is, wages relative to productivity). During recessions, wage inflation is held back but this pales in comparison to the loss in pricing power. At the same time, some degree of labor hoarding creates pro-cyclicality in productivity growth.
Inflation and margin compression will factor into the revaluation of global currencies. We will continue to monitor these.
Section 3. Investment Outlook
Global Pandemic Leads Us to a Recession Forecast for the Next Twelve Months
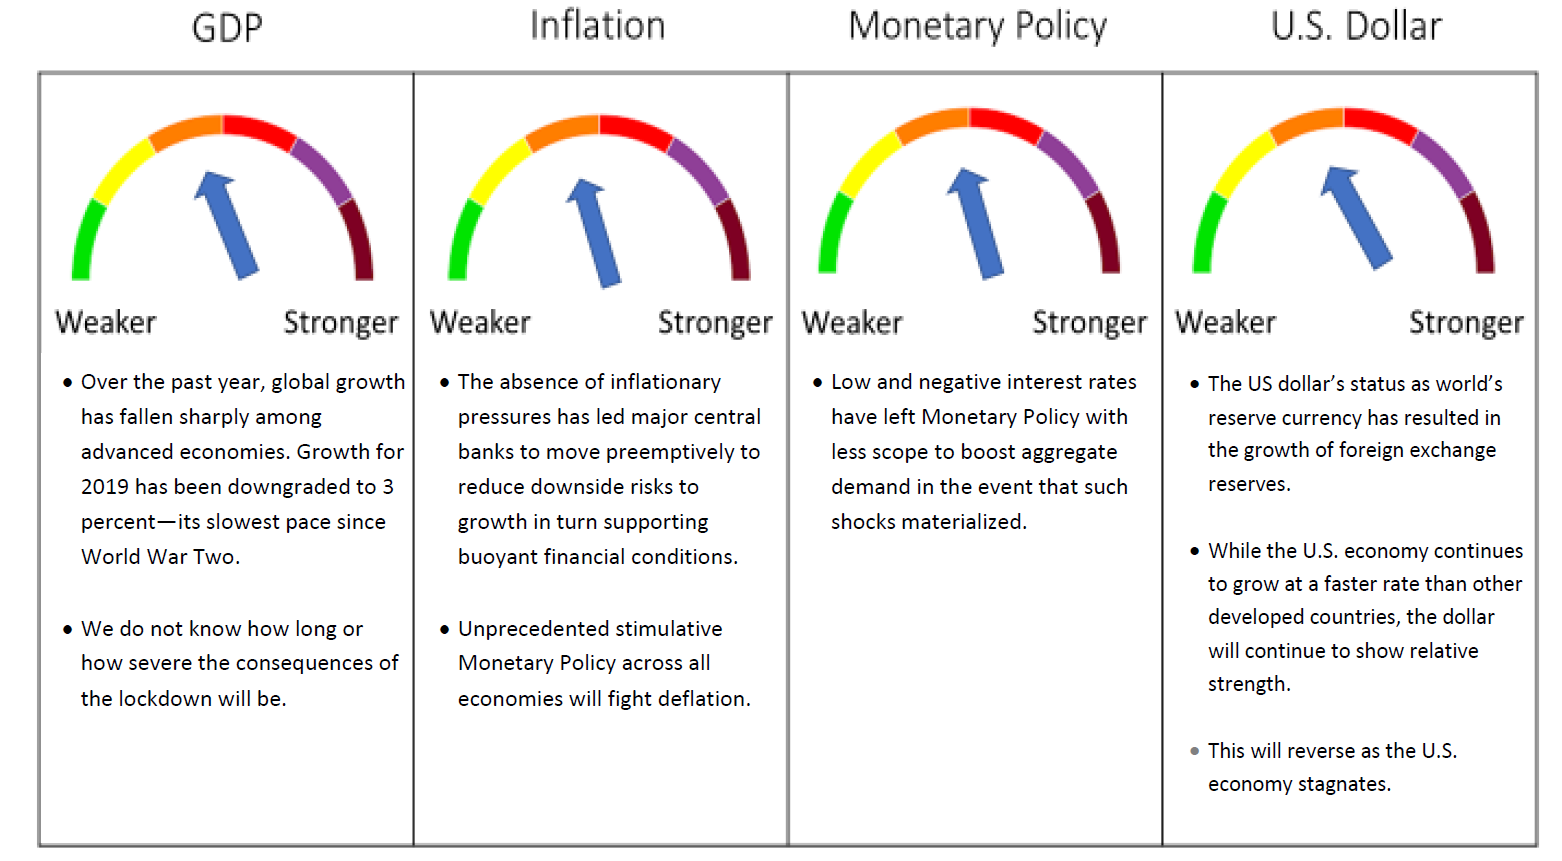
SOURCE: FRAME GLOBAL ASSET MANAGEMENT
Frame Global Asset Management considers these trends and factors them into our outlook for the economy in our twelve-month forward period. We look back to periods of similar economic behavior and use this information to predict the future behavior of the asset classes that we consider. Our investment process allows us to adapt for non-traditional monetary policy and other exogenous variables.
Section 4. March 2020 Portfolio Models
A global recession in 2020 is all but confirmed as nations shut down economic activity to limit the spread of COVID-19. The virus is unique in that it is a demand shock and supply shock, and also a negative wealth, oil price, and credit shock. There will be a wide range of subsequent effects. We are monitoring these developments and have updated our previous Stagnation followed by Recession outlook for the U.S. economy to reflect a Recession in March, extending through to the end of the year, as the situation will deteriorate further before beginning to recover.
In March, we maintained the asset allocation positioning that we established on February 19th. This reflects our view on deflationary and recessionary influences that dominate the global economy.
Deborah Frame, CFA, MBA
President and Chief Investment Officer
April 14, 2020
iIMF. World Economic Outlook. April 14th, 2020.
iiIMF. World Economic Outlook. April 14th, 2020.
iiiIMF. World Economic Outlook. April 14th, 2020.
ivCapital Economics. U.S. Economic Update. April 16th, 2020.
vCapital Economics. U.S. Economic Update. April 16th, 2020.
viIMF. World Economic Outlook. April 14th, 2020.
viiCapital Economics. U.S. Economic Update. April 16th, 2020.
viiiNational Bank of Canada. Public Sector Debt. April 15th, 2020.
ixWorld Gold Council. April 8th, 2020.
xCapital Economics. U.S. Economic Update. April 16th, 2020.
xiCapital Economics. U.S. Economic Update. April 16th, 2020.
xiiTrading Economics. Currencies. April 20th, 2020.