Section 1: Q4 2019 Outlook


Globalization Has Changed the Global Economy. Are We Now in a Period of De-Globalization?

Our investment approach is focused on the expected behavior of asset classes in various economic environments. Our research shows that in addition to five broad economic environments – Growth, Stagnation, Inflation, Recession and Chaos – the global economy also experiences regime shifts, which are temporary, and regime changes, which are permanent. Globalization results in regime change, as does de-globalization. In this Fourth Quarter 2019 Outlook, we take a closer look at the current state of globalization. The recognition of this changing environment is critical in determining our investment positioning in 2020 and beyond.

Economic theory suggests that globalization benefits the world economy. The absence of trade barriers should allow each country to specialize in the production of goods and services in which they are relatively efficient, leading to global productivity gains.

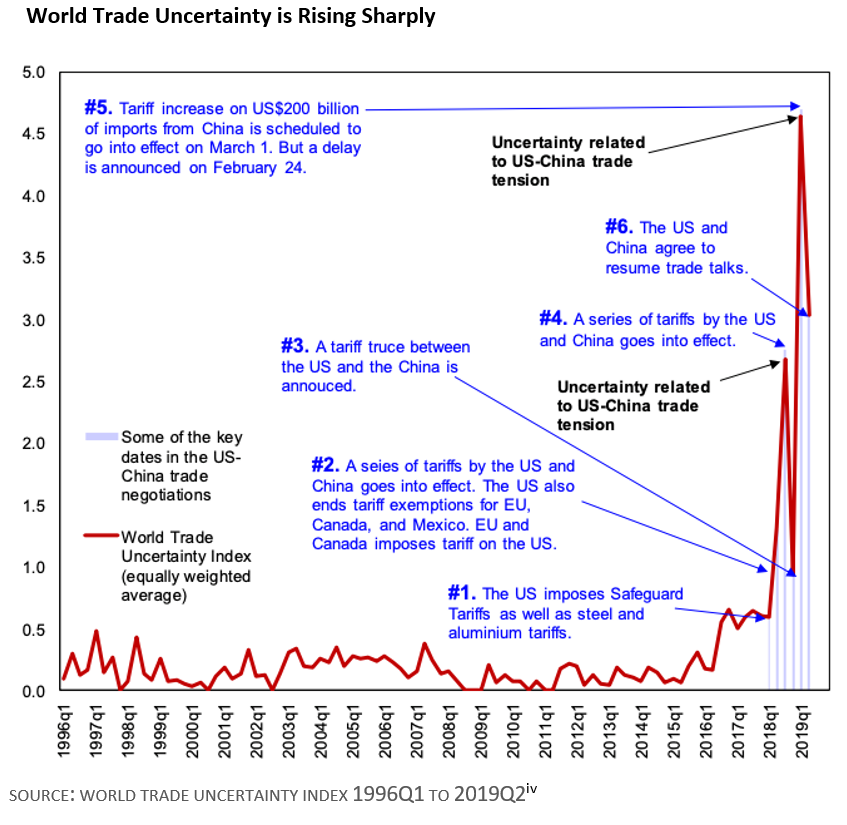
History shows that waves of globalization are driven by both technology and policy, but protectionist shifts tend to end them. In some cases, like in the 1970s, a pushback by policymakers can cause globalization to stall. In more extreme environments like the experience of the 1930s, a sustained policy backlash can push globalization into reverse. So far, the current trade war looks more like a stall but the risk of a de-globalization outcome similar to the 1930s is rising.


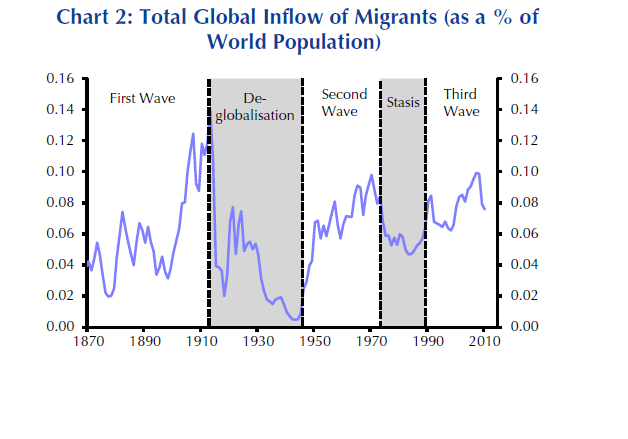
SOURCE: DEMIG (2015), OUR WORLD IN DATA, CAPITAL ECONOMICS


It takes a large and sustained push by policymakers to cause a period of de-globalization. As we begin Q4, the global economy is facing two dangers. The first is that a global economy that is already injured by geopolitical conflicts, including trade wars, endures further negative shocks. The second is that we overestimate resiliency and the feedback loop of slower growth that is occurring in many major economies around the globe.

This is occurring as the U.S. House of Representatives initiates a preliminary inquiry as to whether to proceed with a formal impeachment investigation of President Trump, China potentially delays trade solutions until the 2020 Presidential election, and the deadline for a Brexit decision falls at the end of October. Each of these challenges to the global economy could potentially be prolonged.

Compounding these risks, interest rates worldwide remain low or negative. It is estimated that over 80% of sovereign debt is trading with negative real rates.i While the U.S. Federal Reserve Bank continues to manipulate the economy with artificially low-interest rates, this policy is likely to backfire as the Federal Reserve’s policies mask the true state of the economy. Without an accurate financial picture, businesses lack the knowledge required to make investments. The resulting inaction could bring about the recession the Fed claims it wants to avoid. In addition, the idea that sub-zero interest rates lower the cost of borrowing has not proven to bring about the anticipated economic stimulus that central banks initially anticipated. Instead of paying banks to hold their money, businesses and individuals will find other sources in which to put their money.


Time to Include Gold in our Portfolio Models. Gold is Negatively Correlated with Interest Rates.

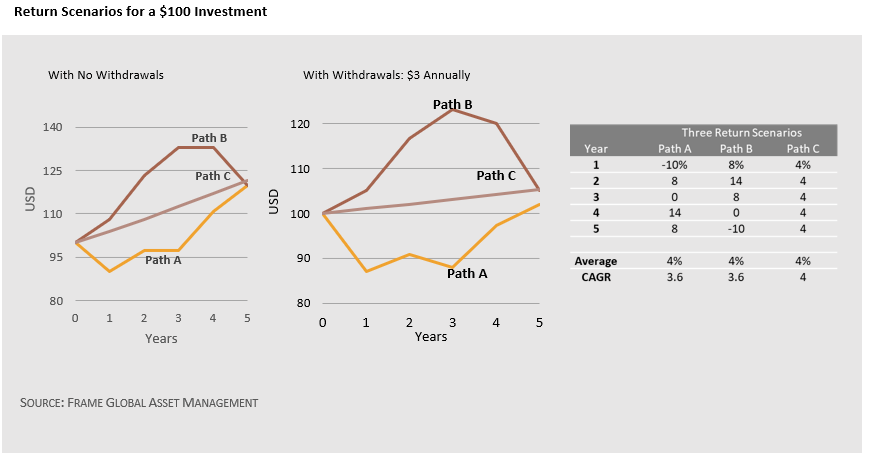
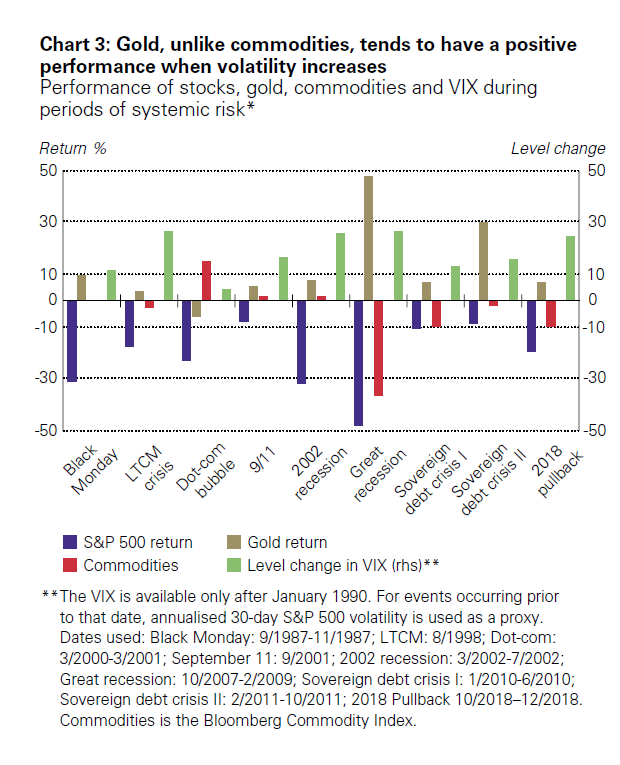
Economic events can create structural shifts in the acceptance level of risk. The global financial crisis of 2008-2009 is one example of these structural changes, referred to in our modelling as Chaos. Looking back at events including Black Monday, the LTCM crisis, and the global financial crisis of 2008 – 2009, World Gold Council analysis shows that gold mitigated portfolio losses incurred by investors during almost all tail events under consideration. For example, investors in the U.S., Europe, and the UK, who held a 5% allocation to gold reduced losses by approximately 5% during eight tail risk events.ii

Our Portfolio Models are seeking exposures that offer low correlations among stocks and bonds to mitigate downside risk. In a year marked by noticeable geopolitical unrest, policy uncertainty and the risk of an impending recession, gold becomes a preferred investment to bonds and equities. And while one of the negatives of holding gold is that it does not generate income and has a cost to store it, the periods when bonds have a negative carry momentum become strong periods for gold.

During September, global monetary policy continued to influence gold price performance as many central banks around the world cut rates or expanded quantitative easing measures. The Federal Reserve cut rates by 25 basis points in July, and again in September.iii

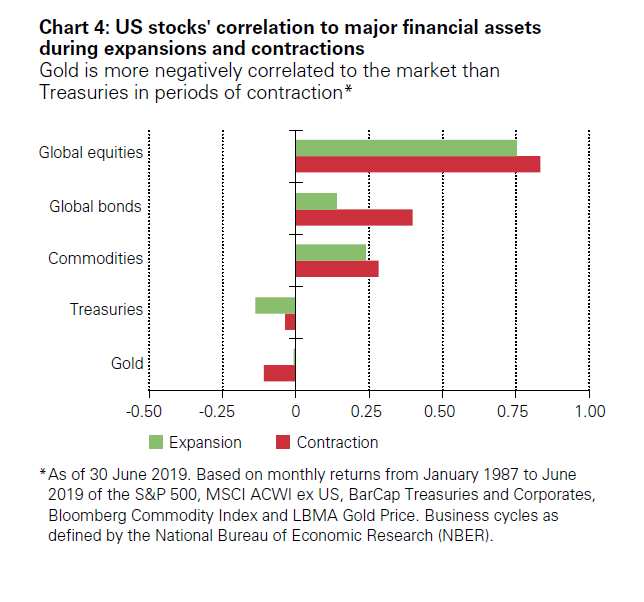
Gold has important diversification properties that are evident during periods of systemic risk. Gold has little or no correlation with many other assets, including commodities, during times of stress. In addition, the correlation is dynamic, changing across economic cycles to the benefit of investors. Like other commodities, gold is positively correlated to stocks during periods of economic growth when equity markets tend to rise. Gold is negatively correlated with other assets during risk-off periods, protecting investors against tail risks and other events that can have a significant negative impact on capital or wealth – a protection not always present in other commodities. As a result, gold can enhance portfolio stability and improve risk-adjusted returns.


Many Central Banks are Adding to Gold Reserves

Analysis of several factors that are propelling the gold market include central bank gold demand. Physical gold is expected to play an important part as countries shore up their havens, both on the private and official levels. While gold no longer plays a direct role in the international monetary system, central banks and governments still hold extensive gold reserves to preserve national wealth and protect against economic instability. Today, gold is the third largest reserve asset globally, following U.S. dollar and Euro-denominated assets.iv Gold is increasingly used as collateral in financial transactions, much like other high-quality liquid assets such as government debt.

History shows us that central bankers were net sellers 30 years ago. These same banks have turned to buying gold since 2010, culminating more than 650 tons of bullion bought from the official sector in 2018 with the trend persisting through the first half of 2019.v This is more than at any time since the end of the gold standard.

We expect that central banks will continue to power gold’s move higher and beyond the current supply and demand dynamics. The October 2019 report from the World Gold Council notes that investors have begun to turn to gold to escape an environment of negative interest rates as treasury yields come under continuing pressure. The U.S. 30-year Treasury acts as a signal here. Should the 30-year U.S. bond fall into negative territory, as has already happened in Germany and France, we expect gold to hit new cycle highs.


With rates likely to stay low and geopolitical unrest unlikely to abate, the demand for gold exposure is expected continue.


SOURCE: BLOOMBERG, WORLD GOLD COUNCIL


SOURCE: BLOOMBERG, WORLD GOLD COUNCIL


Section 2: 4 Themes


Theme 1: Global Trade and GDP are Deteriorating

The multilateral trading system remains the most important global forum for settling differences and providing solutions for the challenges of the 21st century global economy. Trade conflicts heighten uncertainty, leading some businesses to delay the productivity-enhancing investments that are essential to raising living standards. Trade conflicts can also heighten political tensions and occasionally physically aggressive behaviors between countries.


The World Trade Organization Lowers Trade Forecast as Tensions Unsettle Global Economy

Escalating trade tensions and a slowing global economy have led WTO economists to sharply downgrade their forecasts for trade growth in 2019 and 2020. World merchandise trade volumes are now expected to rise by only 1.2% in 2019, substantially slower than the 2.6% growth forecast in April.vi The updated trade forecast is based on consensus estimates of world GDP growth of 2.3% at market exchange rates for both 2019 and 2020, down from 2.6% previously.vii Slowing economic growth is partly due to rising trade tensions but also reflects country-specific cyclical and structural factors, including the shifting monetary policy stance in developed economies and Brexit-related uncertainty in the European Union.

The projected increase in 2020 is now 2.7%, down from 3.0% previously.viii The economists caution that downside risks remain high and that the 2020 projection depends on a return to more normal trade relations. Risks to the forecast are heavily weighted to the downside and dominated by trade policy. Further rounds of tariffs and retaliation could produce a destructive cycle of recrimination.

Shifting monetary and fiscal policies could destabilize volatile financial markets. Continued slowing of the global economy could produce an even bigger downturn in trade. In addition, a disorderly Brexit could have a significant regional impact, mostly confined to Europe.


US Economy Starting to Feel the Pain

More recently, increased foreign competition has been blamed for U.S. manufacturing job losses over the past twenty years. In practice, while the integration of several billion workers into the global economy has contributed to both a loss of manufacturing jobs and a more general squeeze on labour’s share of income in the developed world, most academics agree that other factors, including technological change, have played a bigger role.

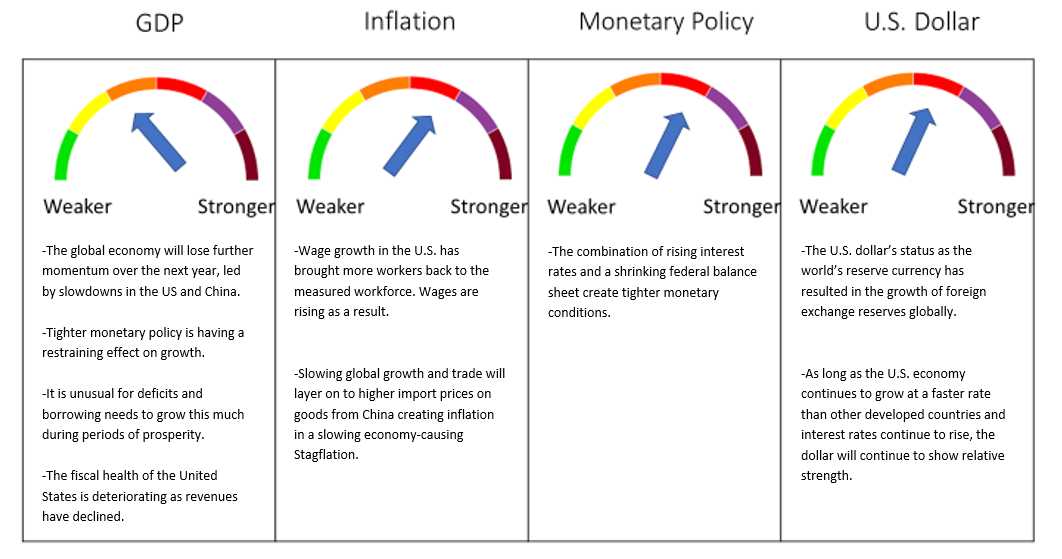
The U.S. economy posted strong gains in the first half of 2019, although some measures were negative. Consumer spending surged in the second quarter, supported by the strong labour market. The decline in interest rates over the summer tees up for U.S. consumers to be the key driver of activity in the second half of the year. Companies continue to hire, and the unemployment rate recently hit a 50-year low.ix Labour market tightness is finally translating into a pickup in wages. Business sentiment has deteriorated amid unrelenting uncertainty about trade. Business investment fell in the second quarter for the first time in three years and exports sagged with the weakness concentrated in the manufacturing sector. While fundamentals are still positive for the consumer, the government’s protectionist policies pose risks to the outlook. The persistence of healthy labour-market conditions, as well as efforts by several central banks to shore up an expansion that’s already passed the 10-year mark, will provide support to the global economy. Another tranche of tariffs on Chinese imports coming into effect in mid-December will hit U.S. consumers.

Open borders tend to boost productivity at a global and national level (particularly for developing countries). However, globalization has distributive consequences within economies. Workers and capital owners in competitive export-orientated industries tend to gain, while consumers’ purchasing power rises from access to cheaper imports. But relatively inefficient domestic industries can lose out to more productive foreign competition.

Our current outlook does not see any material improvement over the next twelve months.


Theme 2: Brexit and the EU: Deal or No-Deal?

The prolonged and twisted saga of Brexit has been a weight overhanging global markets since 2016. UK growth was synchronized with its main trading partners in 2015 but slowed following the 2016 Brexit vote from a range of 2.0- 2.5% to around 1.5-2.0% in 2017.x This occurred despite a clear strengthening in global activity. Throughout the latest phase the labor market has held strong and helped consumers to keep the economy from stagnating. The realistic prospect of no-deal since the change in prime minister has combined with a regional growth slowdown to produce a collapse in business confidence and signs in some of the leading surveys that the labor market is about to weaken. The domestic drag began to stabilize in 2018 after the initial purchasing power shock from the weaker currency peaked. Later in 2018, growth among the UK’s main trading partners slowed and growing complications in the Brexit negotiations prompted a phase of outright decline in UK business spending. Since the referendum UK business investment has weakened by almost 10% compared to capex in other developed markets. Given that UK investment was growing faster than elsewhere prior to the vote.

In a major blow to Prime Minister Boris Johnson, Britain’s highest court ruled in early October that his decision to suspend parliament for five weeks in the crucial countdown to the country’s Brexit deadline was illegal. And unresolved is a legal and operational solution including the Irish border backstop. Currently, there are no border posts or physical barriers between Northern Ireland and the Republic of Ireland. The backstop is designed to ensure that this continues after the UK leaves the EU. The backstop would only be needed if a permanent solution to avoid border checks could not be found. If it was needed, the backstop would keep the UK in a close trading relationship with the EU to avoid checks altogether.

If the sides fail to reach a deal, Mr. Johnson could be forced to seek a third Brexit extension. That’s because MPs have passed a law – known as the Benn Act – that requires Mr. Johnson to ask for a Brexit delay by October 19. This will push the deadline back from October 31 to January 31, 2020. MPs say the law is necessary in order to prevent a no-deal Brexit.

These events unfolding in the UK have the potential to impact European markets and beyond. Regardless of the outcome of Brexit, there is no doubt that the trading relationship between the EU and Great Briton has changed While many Dutch politicians say they dread the economic repercussions of the looming Oct. 31 Brexit deadline, the Netherlands is working to minimize the damage, in part by attracting some of the organizations and businesses that have already fled the United Kingdom.xi


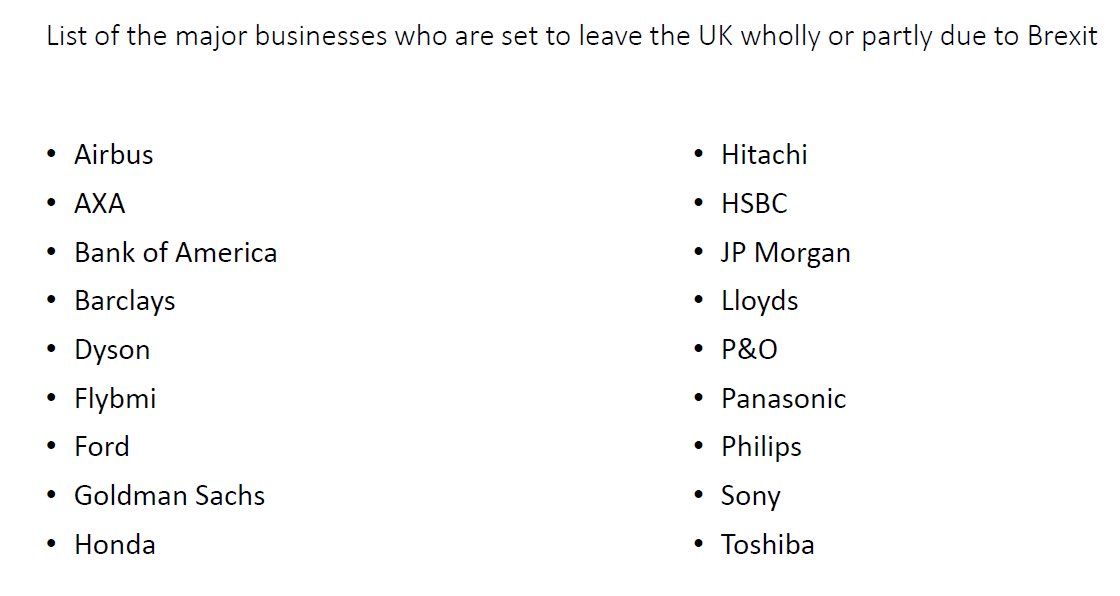
SOURCE: NETHERLANDS FOREIGN INVESTMENT AGENCY


Theme 3: Low and Negative Interest Rates: A Dilemma for Central Banks and the Aging Population

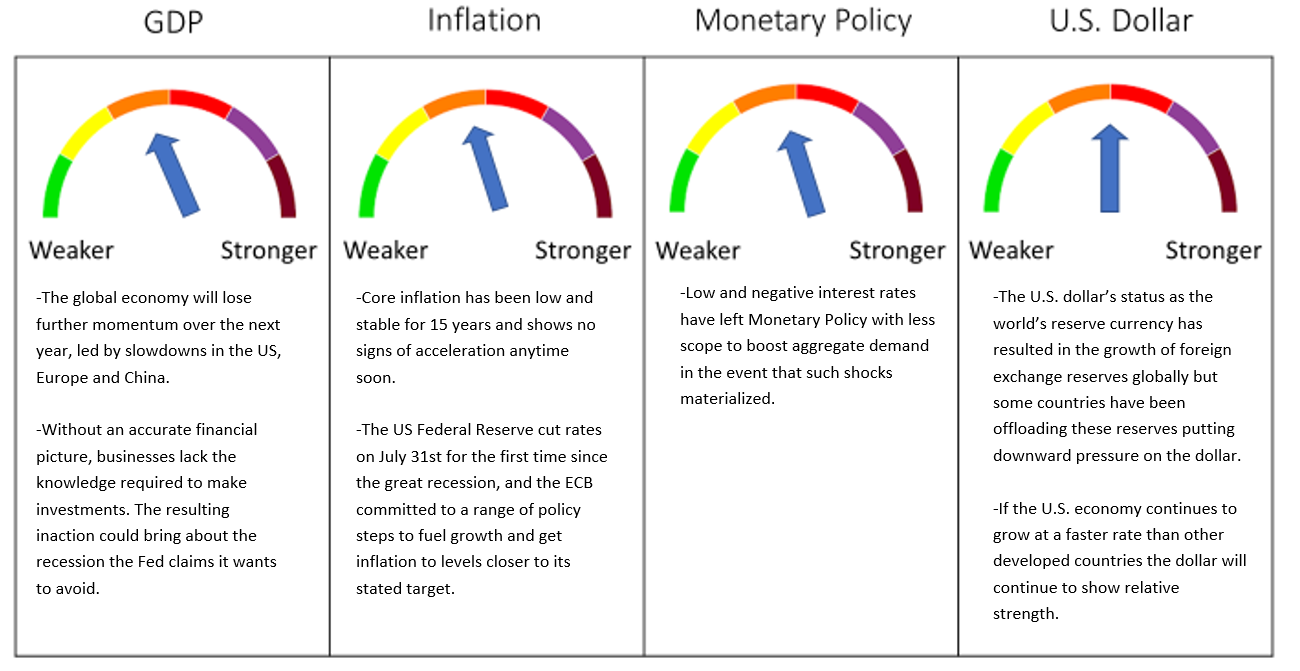
Many central banks reduced policy interest rates to zero during the global financial crisis to boost growth. Ten years later, interest rates remain low in most countries. Core inflation has been low and stable for 15 years and shows no signs of acceleration anytime soon.

The U.S. Federal Reserve cut rates on July 31 for the first time since the Great Recession, and the ECB committed to a range of policy steps to fuel growth and get inflation to levels closer to its stated target. The minutes to the September FOMC meeting show that the Committee held a range of views with respect to both the appropriateness of the September rate cut and to what the Committee should communicate about the future direction of rates. The majority who wanted a cut last month cited trade policy uncertainty, slowing global growth, low inflation, and risk management as motivating considerations. Several participants favored leaving policy rates unchanged and argued policy should respond more to the data than to risks. Some argued that cutting too much now would leave monetary policy with less scope to boost aggregate demand if such shocks materialized.

The two major central banks were among a dozen that eased policy rates to combat the negative spinoff from rising trade tensions and political turmoil. The Bank of Canada was an outlier, staying on the sidelines as Canada emerged from a six-month slump in economic activity. And there is still no firm line of sight on how the UK will leave the European Union. Given these tensions, it will once again fall to extraordinarily stimulative monetary policy to sustain global growth, as few governments have committed to providing fiscal support.


Savings Gluts Provide Fuel for Low Rates

From the demand side, as populations age, they have a propensity to save. Prior to 2005, the global saving rate was never above 24.5%. Since then it has only been lower during the panic of 2009. The rate equaled its record high of 26.7% in 2018. This works out to roughly $21 trillion saved every year.xii Since many seek to match the investments in their savings to their life expectancies, they tend buy bonds.

The savings glut is leading to massive bond buying that is resulting in yields dropping below the inflation rate nearly everywhere in the developed world. Only two countries in the developed world have real 10-year yields above zero: Portugal and Italy.xiii Everywhere else, older people are buying bonds and driving yields below the inflation rate. Demographics tells us the developed world is not running out of old people anytime soon. The savings glut will continue.

While the global economy has been recovering, future downturns are inevitable. Severe recessions have historically required 3–6 percentage points cut in policy rates. If another crisis happens, few countries would have that kind of room for monetary policy to respond.


Theme 4: ETFs have a Positive Role in Market Volatility and Liquidity

Passive investing has historically attracted criticism, typically focused on illiquidity. The liquidity of ETFs varies due to characteristics determined by their underlying markets and indexes. The underlying markets for equity ETFs and credit ETFs are fundamentally different. In addition, apart from the underlying securities in an ETF, there are multiple layers of liquidity in the primary and secondary ETF markets, and the liquidity should never be less than that of the ETF’s underlying holdings. This is a superior feature compared to mutual funds.

ETF market makers and authorized participants looking for arbitrage opportunities trade dynamically to balance the supply and demand for ETF shares and their underlying assets. One of the key features of ETFs is that the supply of shares is flexible. Shares can be created or redeemed to offset the changes in demand. This structure has two important functions: it creates liquidity for the ETF shares by meeting the supply-and-demand needs of investors who trade on an exchange; and it helps keep an ETF’s price per share close to the ETF’s net asset value (NAV).

Index vehicles may be price takers at a microeconomic level but help to set prices at a macroeconomic level. The arbitrage mechanism allows for authorized participants to factor into the price the impact of macro and geopolitical events that may not yet be reflected in the underlying securities when these events occur while the primary markets are closed due to time zones and holidays. Historical evidence is consistent with the idea that higher correlations today are not the result of passive indexing, but rather reflect the macro environment and common factor risks.xiv

Recently there have been liquidity events that have tested the mechanisms behind ETFs. A number of credible studies have concluded that the arbitrage mechanism associated with the create and redeem feature of ETFs in fact helps, rather than hinders market liquidity in these extreme events.xv xvi


Section 3. Investment Outlook


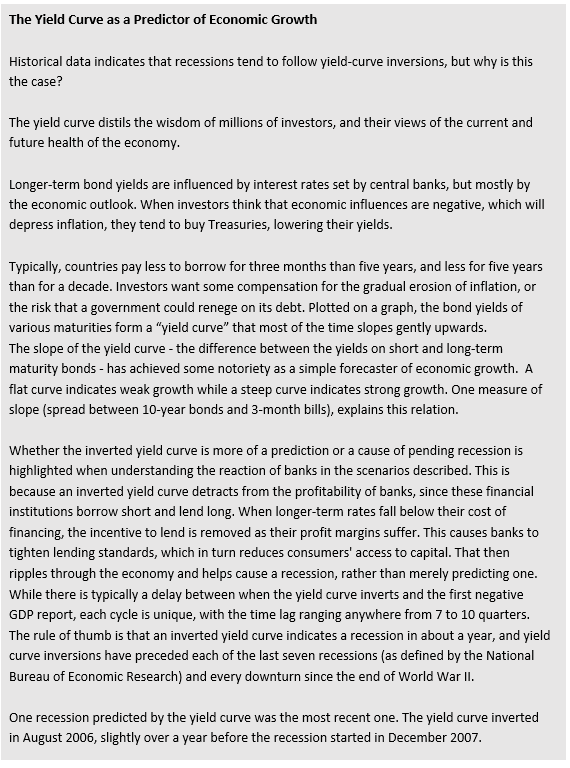
Slowing Global Growth and Inverted Yield Curves Leads Us to a Stagnation Forecast for the Next Twelve Months

SOURCE: FRAME GLOBAL ASSET MANAGEMENT


Frame Global Asset Management considers these trends and factors them into our outlook for the economy in our twelve-month forward period. We look back to periods of similar economic behavior and use this information to predict the future behavior of the asset classes that we consider. Our investment process allows us to adapt for non-traditional monetary policy and other exogenous variables.


Section 4. September 2019 Portfolio Models

We have maintained our Stagnation outlook for the U.S. economy as growth is capped over our forecast time horizon of twelve months. While geopolitical developments have always played a role in economies and markets, their scale and impact has been steadily rising since the 2008 financial crisis. Against a hostile trade backdrop, the global economy is losing momentum. Forecasts for world GDP growth this year have fallen to 3.2% from the 3.9% economists expected a year ago. Inverted yield curves and slumping manufacturing activity that are traditional recession predictors are contributing to a cautious business mood. Few governments have committed to providing fiscal support, leaving extraordinary stimulative monetary policy as the tool of choice to combat the recession threat. Our concern is that central banks in several countries are operating at the limits of what monetary policy can do. This has negative feedback implications for fiscal policy and financial markets.

We will continue to monitor the data for growth, inflation, and recession signals from employment, consumer spending, business sentiment, Fed policy, the yield curve, inflation, and global economics. Our focus is on protecting portfolios from downside risk, and we believe that our investment process is working to achieve that goal.


Deborah Frame, CFA, MBA

President and Chief Investment Officer

October 14, 2019


iWorld Gold Council. Global Gold-backed ETF Flows. October 8, 2019.
iiWorld Gold Council. Gold and Tail-risk Hedging. January 2013.
iiiTrading Economics. U.S. Fed Funds Rate. September 19, 2019.
ivWorld Gold Council. Gold Versus Commodities. October 2019.
vWorld Gold Council. Gold Versus Commodities. October 2019.
viWorld Trade Organization. Press Release. October 1, 2019.
viiWorld Trade Organization. Press Release. October 1, 2019.
viiiWorld Trade Organization. Press Release. October 1, 2019.
ixTrading Economics. U.S. Unemployment Rate. October 4, 2019.
xJ.P. Morgan. Global Data Watch. October 11, 2019.
xiNetherlands Foreign Investment Agency (NFIA). More Brexit-impacted companies choose the Netherlands due to ongoing uncertainty. August 26, 2019.
xiiNational Accounts of OECD Data. Household Savings. 2019.
xiiiTrading Economics. Ten Year Yields. October 15, 2019.
xivMadhavan, A. and Morillo, D. “The Impact of Exchange Traded Funds: Volumes and Correlations.” The Journal of Portfolio Management. Summer 2018, 44 (7) 96-107.
xvMSCI. “Have High-Yield ETFs Created Liquidity Risk?” Reka Janosik. March 27, 2019.
xviAquilina, M., Croxson, K., Valentini, G. “Fixed income ETFs: primary market participation and resilience of liquidity during periods of stress.” Financial Conduct Authority. Research Note. August 2019.


Section 1: Q3 2019 Outlook


The Danger of Politicizing the Central Bank

As we enter the third quarter of 2019, we review recent global monetary policy and question how it has changed the traditional ways that we use it to detect risk in markets and the global economy.

The global economy is expected to continue to slow in the coming quarters resulting in lower inflation and downward pressure on interest rates. Central banks in developed and emerging markets are now generally cutting rates and quantitative easing (QE) is making a comeback. Weak economic data versus central bank activism remains the key theme.

Recently global markets have been encouraged by a truce in the trade war between the U.S. and China as President Trump and Chinese President Xi Jinping agreed to return to talks late in June. While the truce is encouraging following decades of growing trade flows and cooperation, the process of global trade integration faces risk of stalling or going in reverse. And while the U.S. has proven successful in securing a trade deal with Canada and Mexico (that has not yet been signed off on) and extracting some concessions from China, uncertainty remains due to the growing, rather than shrinking trade deficit in the U.S.

Trade contributed 0.94 percentage points to the U.S. economy’s 3.1% annualized growth pace in the first quarter. i Building on that trend, the U.S. trade deficit jumped to a five-month high in May, widening to USD 55.5 billion from a revised USD 51.2 billion in April. Imports surged 3.3% and exports rose 2%. The politically sensitive goods trade deficit with China increased 12.2% to USD 30.2 billion despite the recent increase in import tariffs on Chinese goods. Imports increased, likely as businesses restocked ahead of an increase in tariffs on Chinese merchandise. Data for April was also revised higher to show the trade gap widening to $51.2 billion instead of the previously reported $50.8 billion. ii

Many economists highlight that the most important role of the U.S. economy, as the largest economy in the world and the globally recognized main reserve currency, is in providing liquidity to the global economy and driving demand around the world. Contrary to current Trump trade policy, this implies that the U.S. trade deficit is central to global economic stability. The dollar’s role as the global reserve currency and primary tool for global transactions means that many other countries rely on holding dollar reserves, creating massive demand for U.S. financial assets. This means that the U.S. pays little for its foreign borrowing, allowing it to finance its high consumption at low cost, which boosts global demand.

The IMF Working Paper on Tariffs from May 2019 found that U.S. GDP would decline in scenarios that include retaliation on Chinese trade tariffs imposed by the U.S., but also that U.S. output would decline in the case where China only limits exports of selected goods to the United States. iii This is because those foreign goods (electronics and other manufacturing goods) are particularly difficult to substitute with domestic production, and thus tend to be replaced by additional imports from other countries.

The risk that the Trump trade standoff will unwittingly destabilize the entire global economy and thus have dire consequences for the U.S. economy itself is the greatest current risk to equity markets and the broader global economy.


Global Fundamentals and the Limits on Central Bank Action

After the June FOMC meeting Chair Powell signaled a strong easing bias but indicated a desire to learn more about upcoming policy and data developments. Since then the two main events – the G20 summit and June payrolls – have been positive. U.S. data show that growth has been solid for the first half of the year, supported by a strong labor market and strong financial markets. Inflation remains subdued, and inflation expectations have fallen such that they are no longer consistent with the Fed’s 2.0% target.

But the global picture has deteriorated, and business sentiment has fallen, suggesting that the outlook for the U.S. has also deteriorated. The ECB is expected to ease policy again as the euro area is heavily exposed to a further slowdown in global growth because it has much less policy flexibility. The shift in global policy bias toward easing has also affected the debate around likely Bank of Japan action too, prompted in part when Japanese government bond yields fell further into negative territory.

The gap that has opened between the U.S. manufacturing and non-manufacturing sectors makes clear that trade policy uncertainty is the primary driver of the slowdown. The case for an “insurance” ease remains strong as global growth momentum is slipping and the latest declines in U.S. and global business confidence have yet to be felt.

While it is understood that the unique position of the U.S. in the global economy warrants a central bank that considers the global economy, recent comments by President Trump suggest that his political motives for seeing a continuation of strong equity markets are an attempt to influence the central bank and Chair Powell. Trump’s call for rate cuts while reminding everyone that the American economy is the best it has ever been leads us to this conclusion and has distorted the ability of market participants to detect actual underlying risk.

Central banks in most modern economies are designed to be insulated from the short-term whims of politicians. The goal is to give central bankers the freedom to snuff out inflation, even if that hurts political leaders at election time. Since the global meltdown of 2008, central banks, in the name of protecting the economy, have reacted to sharp market falls by easing policy. Investors have been placated into seeing the stock market as a roller-coaster ride backed by engineers. This creates a false sense of confidence in those markets that can lead to larger negative shocks.

How long can bad news, by going to lower interest rates, be good news for equity prices? Signs that central banks have abandoned monetary policy normalization and are ready to provide additional policy stimulus have encouraged markets as we enter the third quarter of 2019.

Fed rate cuts may happen with the intent to reassure economic actors that the ongoing expansion will continue. But slowing economies and soft inflation imply lower revenue growth, excess capacity, and competitive pricing pressures. The risk is that monetary policy may delay the correction but not prevent it. Given the deterioration in the global economy and policy uncertainty at home, when the correction does come, it will be all the more unanticipated.

Market skepticism, asset purchase limitations, and the potential adverse effects of greater negative yields on banks are all issues we see challenging risk assets. We continue to hope that the U.S. will develop policies that jointly address the U.S.’s need for strong demand and full employment and the rest of the world’s need for dollars by channeling foreign capital into productive, job-creating domestic investment.


Section 2: 4 Themes


Theme 1: Slowing Global Growth

The pace of global growth is slowing this year as policy uncertainty takes its toll on the world’s economy. Data points to the global economy expanding by 3.3% this year, slower than 2018’s 3.6% pace, with trade volumes declining and business sentiment deteriorating. v

Economic and market risks are elevated as a result of the U.S. administration’s use of tariffs at a time when global growth is slowing. The prospect of a prolonged U.S.-China trade war, the lack of clarity around Brexit, and political and economic upheaval in countries like Venezuela have combined to generate downside risks to the outlook.

The stakes are high for this year’s European Parliamentary elections where the populists are likely to continue gaining ground, while lingering tensions and a lack of progress in Brexit negotiations raise the odds of a “hard Brexit” scenario. Another near-term risk, which was cited in the November FSR (Federal Reserve Financial Stability Report, May 2019) is elevated tensions between the European Commission and Italy over Italy’s budget plan, which had raised the country’s borrowing costs and prompted worries about its long-term fiscal sustainability. vi These concerns have been deferred for now, as Italy and the European Commission agreed on a budget plan for 2019, but Italy still faces longer-run fiscal challenges.

European economies have notable international financial and economic linkages, and a sharp economic downturn in Europe would affect banks, markets, and the global economy. Financial market volatility in Europe could spill over to global markets, including the United States, leading to a pullback of investors and financial institutions from riskier assets, which could amplify declines in equity prices and increases in credit spreads. In addition, spillover effects from banks in Europe could be transmitted to the U.S. financial system directly through credit exposures as well as indirectly through the common participation of globally active banks in a broad range of activities and markets. The consequent U.S. dollar appreciation and weaker global demand in such a scenario would depress the U.S. economy through trade channels, which could reduce earnings of some U.S. businesses, particularly exporters. Such effects could harm the creditworthiness of affected U.S. businesses, particularly those that already have high levels of debt.

Amid the uncertainty, global central banks have moved to the sidelines. Even with the economic expansion in its tenth year, contained inflation pressures have removed any urgency for central banks to act.


Theme 2: China’s Non-Financial Sector is Dangerously Over Leveraged

In China, the pace of economic growth has been slowing over the past several years, and a long period of rapid credit expansion has left the non-financial sector highly indebted and lenders more exposed in the event of a further slowdown.

Developments that significantly strain the repayment capacity of Chinese borrowers and financial intermediaries, including a further slowdown in growth or a collapse in Chinese real estate prices, could trigger a collapse in this market. If problems arise in China, spill¬overs could trigger a domino effect with a broader pullback from risk-taking, declines in world trade and commodity prices, and U.S. dollar appreciation resulting. Such an event would tighten conditions in U.S. financial markets and affect the creditworthiness of U.S. firms, particularly exporters and commodity producers facing weaker demand and lower prices. vii

In the recently released book “Crash” by Adam Tooze, China’s credit boom is compared with other credit bubbles that ended badly. viii Tooze highlights that the U.K. banking sector has by far the heaviest exposure to Hong Kong and China in general — much more than the United States, Japan, or Europe. Although the Chinese have not slowed their credit bubble, they have shown an ability to restructure their banking sector in the past – in 1998 to 2005, for example – and more recently to shrink their shadow banking segment. The outlook for the global economy rides on how China manages its current credit situation. Trade-related uncertainty has made Chinese capex expansion less likely. On the monetary side, the ability to cut the reserve requirement ratio (RRR), or the benchmark interest rate and on the fiscal side, the government can issue more special local government bonds are both available. If the Chinese economy does stabilize this year, China’s currency could become a global currency stabilizer.


Theme 3: The U.S. Economy Balancing Act Between Slowing Manufacturing Growth and Strong Markets

The U.S. economy continued to grow at a solid clip in the first quarter of 2019 on the back of net exports and inventory building. ix Growth is likely to be somewhat weaker in Q2. Despite an uneven quarterly pattern, the key driver of the U.S. economy remains the consumer. Strong demand for labour pushed the unemployment rate to a 50-year low in early 2019 and wage growth accelerated. Non-farm employment increased by 224,000 jobs in June, handily beating expectations. The resilience of business hiring is in strong contrast to the recent business surveys’ generally downbeat message. In June, the unemployment rate edged up from 3.62% to 3.67%, and average hourly earnings increased only 0.2%. x

With more people working and wages rising faster than inflation, we expect consumer spending to increase this year. Business investment is also forecast to contribute to the economy as companies take advantage of last year’s cut in the corporate income tax rate and other supportive policies.

On trade policy, the U.S. is the instigator and the perpetuator. The recent removal of tariffs on steel and aluminum imports and the Trump Administration’s desire to ratify the new trade agreement with Canada and Mexico had dampened some of the pressures within North America. Unfortunately, the positive sentiment was crushed in late May when the U.S. threatened to levy tariffs on Mexican imports in order to force its southern neighbor to stem the flow of migrants. Tensions between the U.S. and China, meanwhile, have become increasingly heated after the U.S. bumped up tariff rates and made threats to expand the list of products affected.

The Fed can claim mission accomplished on getting the economy to full employment with most inflation measures at or slightly below the 2% target. Maintaining these conditions is the challenge now facing U.S. policymakers. The FOMC appears content to hold the fed funds rate at a slightly below neutral level as a nod to the risks to the economic outlook coming from an unpredictable presidency.


Theme 4: Canada Is Not an Island

Were Canada an island insulated from global developments, there would be little reason for concern about the economy. Growth is solid, the labor market is strong, and there is no sign of imbalances. But Canada is not an island, and global economic developments matter for its economy. With the global outlook having darkened in recent months, it is fair to say that downside risks prevail in Canada at this point, even if the domestic economy looks fine.

Falling oil prices and a deepening in the housing-market correction saw Canada’s economy grow at just a 0.3% annualized rate in the last quarter of 2018 and contributed to the economy growing at a similar pace in the first quarter of this year. xi A recovery in oil production, easing of pressure in the housing market and the end of an unseasonably cold winter saw the economy post a solid increase in March, paving the way for stronger gains ahead.

Canada’s own tensions with the U.S. have eased with the removal of U.S. steel and aluminum tariffs along with Canadian retaliatory measures. But the ongoing close integration of cross-border production chains means that anything that hurts the U.S. industrial sector will have spillovers to Canada. Concerns about a slowing in global growth could also spill over to Canada’s resource-producing regions via lower commodity prices.

Canadian business confidence has weakened with the manufacturing sentiment index slipping into negative territory in April for the first time in more than three years. xii Global policy uncertainty, frictions with the U.S., and the Chinese government’s banning of Canadian canola all played into the decline.

Although the recent removal of tariffs on steel and aluminum by both the Canadian and U.S. governments and renewed efforts to ratify the updated NAFTA set up to restore confidence, the impact will be limited by the persistence of tensions between the U.S., China, Europe, and Mexico, Canada’s top trading partners. We view the Bank of Canada as more likely to cut rates later this year than not, but we expect those cuts to arrive after the Fed cuts. The difference in timing and magnitude may give the Canadian dollar a slight upward bias relative to its southern neighbor but likely not a large enough one to pose economic danger.

Should significant problems arise in China, spill¬over effects could include a broader pullback from risk-taking, declines in world trade and commodity prices, and U.S. dollar appreciation. The effects on global markets could be exacerbated if they deepen the stresses in already vulnerable EMEs. These dynamics could tighten conditions in U.S. financial markets and affect the creditworthiness of U.S. firms, particularly exporters and commodity producers facing weaker demand and lower prices.


Section 3. Investment Outlook


Slowing Global Growth While the U.S. Fed Pulls Back on Tightening Leads Us to a Stagnation Forecast for the Next Twelve Months

SOURCE: FRAME GLOBAL ASSET MANAGEMENT


Frame Global Asset Management considers these trends and factors them into our outlook for the economy in our twelve-month forward period. We look back to periods of similar economic behavior and use this information to predict the future behavior of the asset classes that we consider. Our investment process allows us to adapt for non-traditional monetary policy and other exogenous variables.


Section 4. June 2019 Portfolio Models

Our outlook is focused on tension between politics, policy, and the positioning of the corporate sector. The world economy remains vulnerable to the U.S-China power play. If tariffs persist or are ramped up further, already-weak world trade volumes will struggle to gain traction. In addition, rising political conflict (Brexit and Italy) and uncertainty have weighed on business sentiment over the past year and global capex is stalling. The dovish stance by central banks supports our Stagnation outlook for the U.S. economy as growth is capped over our forecast time horizon of twelve months.

China is committed to maintaining 6% growth and will respond to any slowing with further easing. xiii The U.S. and China have each raised tariffs and appear to be broadening the conflict to their respective tech sectors. The results of the European Parliament elections showed a significant step up in support for populist parties, who now control 28% of total seats in Parliament, up from 22% before. Turnout in the elections was low at 37%, some 30%-35% lower than may be expected in a general election or second referendum. xiv The Brexit Party’s win (mostly at the expense of the Conservatives) sent the message that many voters are willing to support a no-deal.

We will continue to monitor the data for growth, inflation, and recession signals from employment, consumer spending, business sentiment, Fed policy, the yield curve, inflation, and global economics. Our focus is on protecting portfolios from downside risk, and we believe that our investment process is working to achieve that goal.


Deborah Frame, CFA, MBA

President and Chief Investment Officer

July 14, 2019


iTrading Economics, U.S. Balance of Trade. July 3, 2019.
iiTrading Economics, U.S. Balance of Trade. July 3, 2019.
iiiCaceres, C., and Cerdeiro, D. A., 2019. IMF Working Paper. Strategy, Policy, and Review Department and Western Hemisphere Department. Trade Wars and Trade Deals: Estimated Effects using a Multi-Sector Model.

ivAhir, H., Bloom, N., Furceri, D. Caution: Trade uncertainty is rising and can harm the global economy. 4 July 2019. The source for the data on key dates in the U.S.-China trade negotiations comes from Bown and Kolb (2019). Item #6 comes from the BBC (2019). Note 1: The font in blue indicates the tariff measure taken, and the font in black indicates the narrative of the World Trade Uncertainty index. The WTU index is computed by counting the frequency of uncertain (or the variant) that are near the following words: protectionism, North American Free Trade Agreement (NAFTA), tariff, trade, United Nations Conference on Trade and Development (UNCTAD) and World Trade Organization (WTO) in EIU country reports. The WUI is then normalized by total number of words and rescaled by multiplying by 100,000. A higher number means higher trade uncertainty and vice versa. Note 2: The WUI is computed by counting the frequency of uncertain (or the variant) in Economist Intelligence Unit country reports. The WUI is then normalized by total number of words and rescaled by multiplying by 1,000. The WUI is then normalized by total number of words, rescaled by multiplying by 1,000, and using the average of 1996Q1 to 2010Q4 such that 1996Q1-2010Q4 = 100. A higher number means higher uncertainty and vice versa. While the latest spike is the result of uncertainty over Brexit and US trade policy, trade uncertainty explains more than 70% of the increase in uncertainty since the first quarter of 2018.

vIMF. World Economic Outlook. Growth Slowdown, Precarious Recovery. April 2019.
viFederal Reserve Financial Stability Report. Near-Term Risks to the Financial System. May 2019.
viiFederal Reserve Financial Stability Report. Near-Term Risks to the Financial System. May 2019.
viiiTooze, A., “Health of the Global Banking Sector: Differences by Region.” Columbia University.
ixTrading Economics, U.S. GDP. June 27, 2019.
xBureau of Labor Statistics. Economic News Release. Employment Situation Summary. July 5, 2019.
xiTrading Economics, Canada GDP. July 11, 2019.
xiiTrading Economics, Canada GDP. July 11, 2019.
xiiiSouth China Morning Post. China lowers 2019 GDP growth target to 6-6.5 per cent range. March 5, 2019.
xivJ.P. Morgan Economic Research. Global Data Watch. May 31, 2019.


Section 1. Q2 2019 Outlook


Multiple Factors Raise the Prospect of Risk Asset Volatility

As we look forward to the second quarter of 2019, we expect to experience greater volatility.

Capital around the world moves to markets where it sees the greatest opportunity and to escape other relatively riskier international environments. The U.S. is the largest economy and the largest democracy in the world, and its importance relates to its dominant role in global macro policy setting and driving financial conditions. This is largely driven by relative interest rates, currency differentials, and perceived safety/risk. Common sources of macro risk including the Fed, energy prices, geopolitics, inflation shocks, regulatory change, sovereign risk, elections, and fiscal-policy dysfunction can affect both single stock volatility within an asset class and the correlation among stocks and bonds. i

Volatility in equity markets around the world has reinvigorated debates about its root cause, as has the recent reversal. After the significant drawdowns and large price swings in risk assets in late 2018, volatility dropped sharply, and returns were positive. The S&P 500 rebounded 13.6% during Q1 as interest rates declined in the United States. ii Why this reversal and reduction in volatility has come about is the focus of our current outlook.

Studies confirm that there is a direct link between macroeconomic and geopolitical uncertainty, and volatility and correlations within markets and asset classes. In our Q1 2019 Outlook we highlighted the focus on downside risks both domestically and globally in the markets and in the broader economy.

A negative feedback loop had emerged, centered in the U.S., linking bad policy choices to falling asset prices, tighter financial conditions, and weaker corporate earnings. One of the principal drivers to the sell-off in risk assets in the latter part of 2018 was the fear of a policy mistake by the Federal Reserve and by the unexpectedly hawkish rhetoric of key Fed officials. A more dovish and growth supportive Fed has emerged in 2019, driven primarily by the Federal Reserve’s more dovish rhetoric regarding both further interest rate rises in the U.S. and reversal of its quantitative easing program and the progress on U.S./China trade.

In March, the U.S. Fed’s Beige Book reported a slight increase in growth, as the negative impact of the government shutdown was seen in autos, restaurants, and manufacturing, where consumer spending was slow. iii The Fed met and stayed pat, leaving its interest rates unchanged, as expected, and signaled that there would be no additional interest rate increases for 2019, and that it would end its balance sheet reduction in September.

Despite this, we expect higher volatility to be present for the remainder of 2019. The array of outcomes for key macroeconomic variables is broadening as the U.S. cycle matures. This suggests that the overall volatility regime should be higher across assets as investors demand a higher risk premium for the increased uncertainty.

On the geopolitical front, does progress on trade talks between the U.S. and China negate the likely influence of geopolitical risk across markets over the medium term?

Not in our view.
The current trade war between the U.S. and China has already hurt business confidence and weighed on growth. While recent discussions between the two countries appear to have been more constructive, behind the recent headlines are deep seated issues regarding geopolitical influence, national security, and technological intellectual property. In our view, these are very unlikely to be resolved, even if U.S. tariffs on Chinese goods are lifted.

Heightened geopolitical risks are embedded and likely to impact multiple asset classes for the foreseeable future. The forces of protectionism and populism are deeply entrenched. Risks remain elevated with the Brexit outcome still uncertain, upcoming elections in the European Union, and the leadup to the U.S. 2020 presidential election campaign. The current U.S. administration is unpredictable and the risk that President Trump follows through with tariffs on European auto exports as a result of its Section 232 investigation, and that he continues to be unpredictable in all aspects of international diplomacy, are very real. iv

We focus on minimizing capital losses by recognizing macro and geopolitical risks that are present and expected over our forecast time horizon. The Frame Global Asset Management investment process monitors the global movement of capital into and out of the United States. Few investment models are centered on the movement of capital into markets driven by the macroeconomy. Markets are forward looking, and when we look at the behavior of markets, we see that they eventually reflect the reality of the current and anticipated future macroenvironment. Our investment process incorporates this eventuality. Traditional investment managers are handicapped when their portfolios are “macroeconomic regime” agnostic. We make extensive use of our internal expertise in interpreting economic data. In executing our process successfully, we exploit these inefficiencies and provide our clients with superior outcomes as we focus on minimizing capital losses.

We recognize that aversion to loss is rooted in a current, ongoing, or future need for income as well as an expectation that the value of the investment will be recovered at a future point in time. The lower yield environment that has existed since the global financial crisis in 2008 has also created a greater awareness of the challenges to attaining income goals.

While much attention is paid to asymmetrical pain suffered when experiencing losses compared to gains of the same amount, the reality is that mathematics creates real differences in loss outcomes. A loss of 50% requires a recovery in dollars equal to 100% to make up the lost ground. It is not merely a feeling; it is a real hit to wealth and a hit to the ability to recover on a reduced asset base. Percentages create a sliding scale of absolute dollar returns as the base on which the percent is applied moves up and down, above and below the original investment value. While time may help in recovering from early in the investment period losses, the withdrawal of income along the way has a significant impact on the ability of the investment to grow, particularly when the hits to growth occur early in the investment period. In the most basic sense, the problem comes from differences between steady timing of withdrawals and the unpredictable swings in the fund’s investment value (see graph below).

We believe that multiple factors across the developed world raise the prospect of risk asset volatility as global growth slows down in the second quarter of 2019. High volatility increases the chances that you will be taking money out when the portfolio is down, forcing you to lock in your losses. The impact can be particularly damaging if the downturn happens early in the withdrawal period.

We will be monitoring these risk factors and adjusting our portfolio models to protect you from this risk.


Section 2. Four Themes


Theme 1: Slowing Global Growth

After the synchronized growth of 2017, the rate of acceleration in global economic growth has moderated quite significantly over the past year. The best explanation for the slowdown in global growth is that country-specific problems have started to weigh on activity in the world’s three major economic regions, the U.S., China, and Europe, and have then been amplified through various feedback loops. In addition, it’s possible that political uncertainties are beginning to weigh on business investment in some countries, especially those in Europe.
While it is common for global downturns to have their roots in several different areas, the current situation is unlike the last downturn in 2008-09 which was unusual both because of its size and because it had a single cause (debt and housing).

The World Trade Organization said global trade shrank by 0.3% in the fourth quarter and estimates will grow by just 2.6% in 2019, down from 3% in 2018. v Global GDP growth has slowed from 3.8% year over year in the first quarter of last year to around 3% year over year currently. Though that may not seem significant, the IMF has previously suggested that a figure below 3% constitutes a global recession. vi So this is serious.

The major driver of the slowdown is the lagged impact of tightening financial conditions globally and trade tensions impacting business sentiment and investment. Momentum across recent macroeconomic data releases for major economies has been clearly negative with little sign of durable stabilization.

At a sectoral level, manufacturing has borne the brunt of the downturn, resulting in a sharp decline in global trade. In contrast, the service sector has been relatively resilient.

The U.S. economy has held up relatively well so far, but the monthly activity data and business surveys are now pointing to a more marked slowdown in growth in 2019. The relatively high quality of U.S. data releases further enhances its importance as emerging global impulses are often identified most clearly in the Unites States.

While China’s economy is smaller and its data releases are more difficult to read, its outsized contribution to global growth and its central role in global supply chains has enhanced its importance in global data watching. There is a series of thematic trends driving China’s economy in the future, including the rebalancing of global capital toward Chinese markets, data-driven innovation, industrial upgrading, sustained growth in the consumer sector, and the reorienting of China’s trade relationship. The last ten years of stimulus and deleveraging is a story of “eight-plus-two.” Eight years of government stimulus after the global financial crisis, followed by a couple years of conscious deleveraging and credit reduction. Since 2016, regulators have acknowledged growth challenges and emphasized deleveraging. The government’s crackdown on shadow banking and peer-to-peer lending, including arrests of executives, is having an additional dampening effect on the flow of credit. This has led to a significant drop in credit availability over the past 24 months. Growth in outstanding credit fell to 7% in 2018 from 13% in 2017, below nominal GDP growth of 9.7%. vii

There is now evidence of cooling of Chinese GDP growth, especially since the middle of last year, and sales of cars and smartphones have been dropping steeply. Some high-profile companies are flashing warnings of plunging sales and some even of job cuts. The pain is felt in broader Asia as well, home to some of the world’s most export-reliant economies. The McKinsey Global Institute’s Economic Activity Index, which tracks the performance of the Chinese economy using a basket of 57 different indicators ranging from retail and property sales to electricity consumption, measures the dipping trend line in China’s official GDP numbers. viii

Despite the doom and gloom, China continues to demonstrate one of the strongest growth rates in the world, adding the equivalent of “another Australia” each year. Consumers continue to trade up to more expensive premium goods and some companies are registering record sales. China’s effort to rebalance the economy toward consumption and services contributed about 76% and 60% of its GDP growth, respectively. ix

We also know that the slowdown has been particularly severe in Europe. Europe is not as large as the U.S. and does not contribute to global growth as much as China, but Europe’s latest political and economic news raises the risk that it will be the source of a significant negative global shock this year.

While the ECB said that it will start its third program to stimulate bank lending to counter a softening economy and that it would hold rates low at least through 2019, these programs have been contributing to greater macro-policy lead volatility.

The Western European economy comprises over 20% of global GDP and becomes a central driver of the global business cycle when it experiences a significant idiosyncratic shock. This was the case during the European sovereign crisis in 2011-13, while Europe’s acceleration in 2016-17 was a key contributor to strong synchronized growth phase. x

Looking to the U.K., the recent descent of U.K. politics into chaos raises a global threat. It is increasingly difficult to see the U.K. navigating through this mess without a general election. However, both the Conservative and Labour parties are being led from extreme positions, and it is unclear that an election will result with the consensus needed to forge a deal. Although the EU Council of Ministers threat of a “no deal” deadline to force the U.K. into making quick decisions will likely be relaxed in the event of a general election, uncertainty will linger and weigh on U.K. and EU growth.

We continue to monitor global growth.


Theme 2: Inverted Yield Curve and Recession Risk

Equity market corrections don’t have a great history of predicting recessions but yield curve inversions have been more reliable. In fact, since 1977, every yield curve inversion has been followed by a period of economic contraction, measured by GDP. xi

On March 20, the Fed announced that it would keep rates unchanged, holding its policy rate between 2.25% and 2.5%. xii In addition, the central bank alluded to no more rate hikes for the rest of 2019 after initially forecasting two. The central bank has been on a path towards asset reduction, which they say would come prior to the end of 2019. Following the Fed announcement, on March 22, the U.S. yield curve inverted with the 10-year Treasury yield dipping below the 3-month T-bill yield for the first time since 2007. The inversion lasted five trading days and then tipped positive again. Combined with the length of the post-crisis expansion and deteriorating economic data, the inverted yield curve has stirred fears that the countdown to the next downturn has already begun.

Post-crisis regulation encouraged banks to keep more money in ultra-safe assets, and it is hard to find anything safer than U.S. Treasuries. The Fed is still sitting on $3.7 trillion of Treasuries held prior and acquired through bond-buying programs, while negative interest rates and quantitative easing programs in Europe and Japan have nurtured demand for highly rated debt. xiii Combined with secular forces such as technology and demographics that keep inflation low, longer-term yields are expected to be kept down.

Complicating the issue is that the U.S. government is financing much of its budget deficit by issuing short-term bills rather than longer-term bonds. We expect that the recently shrinking Fed’s balance sheet and interest rate increases will continue to exert upward pressure on Treasury bill yields. We may prefer to look at the 2-year and 10-year Treasury yields as a cleaner measure of the curve’s shape. This spread has remained positive. The 2-year and 30-year spread, another popular measure, has steepened this year, muddying the yield curve’s signal. Japan, the U.K., and Germany have all seen inversions in the past without suffering recessions. However, this does not negate the signal the yield curve is sending.

We will continue to monitor the yield curve along with other signs that this economic cycle is in the latter stages: slowing global economic activity, soft earnings growth, and historically high corporate leverage.


Theme 3: The Role of Gold When Investors Seek to Minimize Drawdown Rather than Maximize Performance

There are now broad-based signs of slower growth in most major economies, including the U.S., the Eurozone, Japan, and China. In a contraction, the best performing asset classes are cash, government bonds, and gold.

Investors embraced gold for six months up to February of this year. The price of gold rose 14% from August 15, 2018 to February 20, 2019, as economic uncertainty and heightened volatility dominated markets. xiv Since then volatility has declined, putting a damper on gold prices at the end of February.

While no clear evidence points to an immediate positive impact on the price of gold after the Fed pauses, gold did move up during the days when the yield curve inverted in March. Historical analysis suggests that gold eventually reacts positively as the pause cycle extends and/or the Fed eases monetary policy. Historical post-tightening periods have shown an eventual strong gold performance, counterbalancing the performance of risk assets such as stocks or commodities, and complementing assets such as Treasuries and corporate bonds.

Gold consumption has seen geographical changes over the past decade. Gold demand seems to have moved ‘West to East’ as emerging markets have become larger consumers of gold. China and India currently make up over 50% of global consumer demand while the U.S., Western Europe, and Japan have become less significant consumers. xv

The 2008 crisis prompted a change in central bank behavior. Sales by Western central banks were more than offset by gold purchases by emerging central banks, whose reserves increased strongly due to their external surpluses linked to their rising share of global trade (China in particular) as well as rising commodity prices (Russia). The major buyers of gold since 2000 among central banks have been large emerging countries such as China, Russia, India, and Turkey. xvi

Over 20 central banks added gold to their foreign reserves in 2018, some after multi-year absences. In a recent survey by the World Gold Council, 76% of central banks viewed gold’s role as a safe haven asset as highly relevant, while 59% cited its effectiveness as a portfolio diversifier. Additionally, almost 1/5th of central banks signaled their intention to increase gold purchases over the next 12 months. xvii

Many Emerging market central banks have continued to diversify their exposure to US dollars, and gold has been a key beneficiary. European central banks who have bought gold include Poland, Hungary, Russia, Kazakhstan, and Turkey. The desire to de-dollarize foreign exchange reserves, in response to deteriorating geo-political relations in some parts of the world, motivated purchases. Other central banks bought gold for diversification and, in Hungary’s case, partly as a hedge against structural changes in the international financial system.

We model gold as an asset class and will be watching the economic conditions that benefit gold as we move through 2019.


Theme 4: The U.S. Dollar Role as Reserve Currency

By the end of the 20th century, the US dollar was considered the world’s most dominant reserve currency. The world’s need for dollars has allowed the U.S. government, and Americans, to borrow at lower costs. Any change in confidence in the U.S. currency, due to economic and political factors, impacts the strength or weakness of the dollar.

During the first quarter, the U.S. dollar appreciated slightly with the U.S. Dollar Index (DXY) rising 1.2%. The euro declined 0.2%, the yen declined 1.1%, and the Brazilian real declined 1.0% against the U.S. dollar, while the Canadian dollar was up 2.2% and the Mexican peso was up 1.1% against the dollar. xviii

Continuing the trend since 1971, rising private and public debt is a source of structural U.S. current account deficits, which may eventually translate into dollar depreciation. The US dollar experienced a 2.85% average annual depreciation against gold (from $35/ounce in August 1971 to the $1,282/ounce level observed as of the end of 2018). xix

In the first quarter, the trade-weighted index was down only 1%, with depreciation against only one-third of G10 currencies while depreciating against two-thirds of EM ones. xx Over the past 25 years, both blocs have either appreciated against the dollar (32% of quarters) or appreciated (45%). It’s unusual for these two blocs to move in different directions. This year, the dollar has gained against most major currencies but declined against most EMs. Strong country-specific influences outside the U.S. explain this anomaly.

Currencies are a relative price; typically driven by relative growth and relative monetary policy rather than the U.S.’s absolute fundamentals. Correlations between Fed policy and the dollar are more difficult to predict, explaining why U.S. equity strength can occur alongside both a strong dollar (31% of instances) and a weak dollar (37% of instances). xxi The dollar is behaving as expected by declining with yields, even if the pairwise performance is quite mixed given that many non-U.S. economies have experienced more disappointing growth and greater declines in yields this year.
We will be watching this potential de-correlation within currencies as non-U.S. conditions change.


Section 3. Investment Outlook

Slowing Global Growth While the U.S. Fed Pulls Back on Tightening Leads Us to a Stagnation Forecast for the Next Twelve Months

SOURCE: FRAME GLOBAL ASSET MANAGEMENT


Frame Global Asset Management considers these trends and factors them into our outlook for the economy in our twelve-month forward period. We look back to periods of similar economic behavior and use this information to predict the future behavior of the asset classes that we consider. Our investment process allows us to adapt for non-traditional monetary policy and other exogenous variables.


Section 4. March 2019 Portfolio Models

In March, we held our asset allocation constant at the February allocations. Allocation to Equities remains at 30% in Tactical Conservative, 40% in Tactical Moderate Growth, 50% in Tactical Growth, and 60% in Tactical Aggressive Growth, continuing the exposure to U.S. equities, with the balance in all models allocated to U.S. municipal bonds and mid-term U.S. treasuries. This asset allocation continues to reflect our concerns that the U.S. economy is slowing but is more stable than other global equity markets and the relative attractiveness of interest rates in the U.S. versus the rest of the world.

Geopolitical risks remain elevated with Brexit’s outcome uncertain, upcoming elections in the European Union, and the leadup to the U.S. 2020 presidential election campaign likely to impact economic growth and markets. In addition, the combined effects of sanctions on Iran’s and Venezuela’s oil sectors, Saudi Arabia’s need to push oil prices up in order to get its finances in order, and of the recent agreement by OPEC and other countries to cut production means that geopolitics could have an outsized impact on oil prices over the next several months.

Progress on U.S./China trade negotiations and the Federal Reserve’s more dovish rhetoric regarding further interest rate hikes have not convinced us to change our forward outlook that expects the U.S. economy to experience stagnation over the next twelve months.


Deborah Frame, CFA, MBA

President and Chief Investment Officer

April 14, 2019


iVolatility is a statistical measure of dispersion of returns for a security. Volatility is measured using the standard deviation or variance of returns of that security. A higher volatility means that the security’s value covers a larger range. Correlation is a statistical measure that indicates the extent to which two or more variables fluctuate together. A positive correlation indicates the extent to which those variables increase or decrease in parallel; a negative correlation indicates the extent to which two or more variables more in opposite directions.
iiS&P Dow Jones U.S. Dashboard, March 2019.
iiiThe Beige Book. Summary of Commentary on Current Economic Conditions, By Federal Reserve District. March 6, 2019.
ivOn March 8, 2018, U.S. President Donald Trump signed two proclamations placing tariffs on imports of steel and aluminum. The tariffs are authorized under Section 232 of the Trade Expansion Act of 1962 on the grounds of national security.
vWorld Trade Organization. Global trade growth loses momentum as trade tensions persist. Press/837. April 2nd, 2019.
viCapital Economics. The Chief Economists Note. Taking stock of the health of the global economy. March 18, 2019.
viiMcKinsey & Company. China Brief: The state of the economy. March 2019.
viiiMcKinsey & Company. China Brief: The state of the economy. March 2019.
ixMcKinsey & Company. China Brief: The state of the economy. March 2019.
xJ.P. Morgan. Global Data Watch. Economic Research. March 22, 2019.
xiAmadio, Kimberley. The Balance. Inverted Yield Curve and Why It Predicts a Recession. March 26, 2019.
xiiFederal Reserve Board. Federal Reserve Issues FOMC Statement. Press Release. March 20, 2019.
xiiiFederal Reserve Board. Quarterly Report on Federal Reserve Balance Sheet Developments. March 23, 2019.
xivBloomberg.
xvReade, John. World Gold Council. Gold Investor, February 2019. February 12, 2019.
xviAmundi. Investment Insights Blue Paper. Gold in central banks’ asset allocation. March 2019.
xviiGopaul, Krishan. World Gold Council. Goldhub blog. Strong start for central bank demand in 2019. April 8, 2019.
xviiiBloomberg.
xixAmundi. Investment Insights Blue Paper. Gold in central banks’ asset allocation. March 2019.
xxJ.P. Morgan. Cross-Asset Strategy. The J.P. Morgan View. April 5, 2019.
xxiJ.P. Morgan. Cross-Asset Strategy. The J.P. Morgan View. April 5, 2019.


Section 1. Q1 2019 Outlook


As we enter 2019, there is a heightened focus on downside risks both domestically and globally in the markets and in the broader economy. A negative feedback loop has emerged that is centered in the U.S., linking bad policy choices to falling asset prices, tighter financial conditions, and weaker corporate earnings.

The IMF said in an update to its World Economic Outlook in October that it is now predicting 3.7% global growth in both 2018 and 2019, down from its July forecast of 3.9% growth for both years. i

Across emerging market and developing economies, prospects are mixed. The downgrade reflects several factors, including the introduction of import tariffs between the United States and China, weaker performances by eurozone countries, and rising interest rates that are pressuring some emerging markets with capital outflows into the stronger U.S. dollar, notably Argentina, Brazil, Turkey, South Africa, Indonesia, and Mexico. Forward projections are less good for Latin America, the Middle East, sub-Saharan Africa, and Iran, reflecting the impact of the reinstatement of US sanctions. ii

In conjunction with the global growth downgrade, the IMF downgraded the 2019 U.S. growth forecast to 2.5% from 2.7% and cut China’s 2019 growth forecast to 6.2% from 6.4%. iii

Since the October IMF Report, tighter monetary conditions and the intensification of trade tensions have had a further impact on business and financial market sentiment, triggering financial market volatility and slowing investment and trade.


U.S. Policy Reversal Required

The U.S. move to more restrictive monetary policy includes both increasing the fed funds rate and removing liquidity across markets as Quantitative Easing is unwound by not rolling over treasury bonds on the federal balance sheet as they mature. This has led to greater tightening than the rising of the fed funds rate alone would cause. The combination has led to market volatility rising from the greater sensitivity to the price impact of minor macroeconomic events.


SOURCE: BANK FOR INTERNATIONAL SETTLEMENTS, FACTSET, J.P. MORGAN ASSET MANAGEMENT.

DATA AS OF NOVEMBER 8, 2018.


Emerging markets have been impacted particularly hard by U.S fiscal stimulus and monetary policy tightening. As a result, emerging economies have experienced capital flight and rising dollar-denominated debt. The ongoing threat of higher trade barriers that would disrupt global supply chains and slow the spread of new technologies, ultimately lowering global productivity, would feed into higher volatility. These restrictions would also make consumer goods less affordable, harming low-income households disproportionately.

Those relying heavily on exports have suffered the effects of lower commodity prices, and those trading indirectly with China have also felt the effects of the trade war. The deflationary effects of global recession are expected to erode inflation and increase global demand for high quality cash and fixed income, which would most certainly find its way to the United States.


SOURCE: VANGUARD RESEARCH. DECEMBER 2018.

VANGUARD CALCULATIONS BASED ON FEDERAL RESERVE’S FRB/US MODEL.


The threat of a global recession is real, as the U.S. is the largest global economy and the US Dollar remains the world’s reserve currency. While trade wars would create long-term negative impacts to the global economy, the U.S. “America First” policy has pushed up short-and long-term interest rates and strengthened the dollar relative to other currencies.

The problem is not that trade practices in the rest of the world are creating the U.S. trade deficit, rather that the economic policies of the United States are the source of the problem. US Dollar strength will continue to make the trade imbalance wider, giving protectionists more ammunition to raise the ante in a spiraling situation.

Our concern is that current policies are expected to have stagflationary effects (reduced growth alongside higher inflation). A limit in foreign direct investment and broad restrictions on immigration, which reduce labor-supply growth at a time when workforce aging and skills mismatch, would continue to contribute to the problem.

To break the loop, three policy reversals must happen. The first is to reign in massive U.S. deficit spending that is occurring during a period of economic expansion. The second is that monetary policy, including rising interest rates and a shrinking fed balance sheet, needs to be slowed or reversed. And third, a truce on U.S.-China trade must hold beyond March.

Until we see these policy reversals, our Outlook for the next twelve-month period is for six months of Stagnation followed by six months of Recession.


Meanwhile in Canada

The Canadian economy is set to weather the current slump in global oil prices better than it did in 2015, but we expect it will not escape unscathed. The 9,300 job increase in employment in December was better than expected, and the unemployment rate held at a 40-year low of 5.6%. iv The housing market is showing signs of weakness, and there are signs that higher interest rates are starting to weigh on consumer spending. v In the absence of further rate hikes, we expect GDP growth to slow from 2.0% in 2018 to 1.5% in 2019. The Bank will likely cut rates in 2019.

Frame Global Asset Management adheres to an investment process that focuses first and foremost on identifying and minimizing downside risk. We do this by recognizing the past relationships between asset class behavior in economic environments and analyzing the current environment and relationship with asset classes.


Section 2. Four Themes


Theme 1: Less Liquidity in U.S. Financial Markets

Recessions are typically triggered by policy mistakes, and the Federal Reserve may very well be on the road to making one as fears that the central bank will raise interest rates by too much and too quickly weighed heavily on stocks in 2018.

The Fed increased its target rate four times in 2018, with the final hike of the year coming in December, sending the equity markets into a tailspin. vi The Federal Open Market Committee (FOMC) implements monetary policy to help maintain an inflation rate of 2% over the medium term. The FOMC judges that inflation at the rate of 2% (as measured by the annual change in the price index for personal consumption expenditures, or PCE) is most consistent over the long run with the Federal Reserve’s mandate for price stability and maximum employment.

The policy statement that accompanied the Fed’s latest rate hike did attempt to allay fears that the Fed would tighten too much by acknowledging the economic outlook has diminished and that the balance of risks was now roughly even. FOMC participants also slightly lowered their expectations for the federal funds rate and now call for just two rate hikes in 2019 and one more after that. The drawdown of the Fed’s balance sheet is expected to run off at about $6 billion a month and mortgage-backed securities to run off at about $4 billion a month, rising to a combined maximum $50 billion a month in 2019. vii

While this ongoing move to tighten monetary conditions was underway throughout 2018, fiscal policy via massive tax reform changes was intended to provide stimulus to the already robust U.S. economy. 2018 kicked off with the enactment of tax cuts that pushed up long-term interest rates and created a sugar high in an economy that was close to full employment.

Supporters of the tax cuts repeatedly claimed the bill would increase economic growth enough to offset the decline in tax receipts, but corporate tax revenues are down one-third from a year ago. Total federal revenues ran $200 billion behind the Congressional Budget Office’s forecast for the 2018 fiscal year even while economic growth was faster than the C.B.O. expected. The nonpartisan Committee for a Responsible Federal Budget reports that nominal federal revenues are down by at least 3.6% since the tax cuts took effect. The federal budget deficit — the gap between what the government collects in revenues and what it spends — rose to $779 billion in the 2018 fiscal year ending September 30, a 17% increase from the prior year. viii

The continuing growth in the budget gap means the Treasury must borrow more to keep the government running. A total of $1.338 trillion is expected to be borrowed from global investors this calendar year, 145% higher than the $546 billion borrowed last year. This would be the highest level of borrowing since 2010, back when the American economy was struggling to recover from the Great Recession. ix

One of the consequences of the tax code changes was that in the first half of 2018, about $270 billion in corporate profits previously held overseas were repatriated to the United States and spent. Some 46% of that amount was spent on $124 billion in stock buybacks. x

The flow of repatriated corporate cash is just one example of the flood of payouts to shareholders, both as buybacks and dividends. Such payouts are expected to rise by 28% this year to almost $1.3 trillion. The surge in buybacks has added controversy over the tax cut package that President Trump championed. Republicans said the deal would be “rocket fuel” for the American economy. Democrats argued the share buybacks show that the tax cuts were a giveaway to the wealthy and won’t stimulate corporate investments and job creation.

It’s highly unusual for deficits and borrowing needs to grow this much during periods of prosperity. Despite a strong economy, the fiscal health of the United States is deteriorating fast, as revenues have declined.


Theme 2: Rising Global Trade Restrictions

Escalating trade tensions and the potential shift away from a multilateral, rules-based trading system are key threats to the global outlook. An intensification of trade tensions and the associated rise in policy uncertainty has already triggered financial market volatility and slowed investment and trade. The latest U.S. actions against China seem to fuel a broader trade, economic, and geopolitical cold war.

Since the IMF’s April 2018 World Economic Outlook, protectionist rhetoric has increasingly turned into action, with the United States imposing tariffs on a variety of imports.

Following tariff increases in early 2018 on washing machines, solar cells, steel, and aluminum, the United States announced a 25% tariff on June 15th on imports from China worth $50 billion; China announced retaliation on a similar scale. On September 17th, the United States announced a 10% tariff—rising to 25% by year end—on an additional $200 billion in imports from China. In response, China announced tariffs on a further $60 billion of U.S. imports. The United States has also suggested that a further $267 billion of Chinese goods—covering nearly all remaining Chinese imports—may be hit with tariffs, and it has separately raised the possibility of tariffs on the automotive sector that would affect many other countries. xi

The two countries’ trade teams have been given until March 1st to agree on structural changes in China with respect to “forced technology transfer, intellectual property protection, non-tariff barriers, cyber intrusions and cyber theft, services, and agriculture”. American authorities have long accused China’s government of forcing foreign companies to give their proprietary technology to Chinese partners, but such demands are not enshrined in Chinese legislation and not recorded.

Permanently higher trade barriers would disrupt global supply chains and slow the spread of new technologies, ultimately lowering global productivity and welfare. Restrictions would also make tradable consumer goods less affordable, harming low-income households disproportionately.


Theme 3: Slowing Global Growth

The surge in the U.S. ADP measure of private employment to 271,000 jobs in December provides further evidence that, for all the recent volatility in financial markets, the U.S. economy is in healthy shape going into 2019. xii It appears that higher wages are the reason why people are returning to the active labour force in large numbers. Average hourly earnings increased by 0.4% m/m last month, enough to push the annual growth rate up to a near-decade high of 3.2%, from 3.1%. xiii

However, tightening monetary policy, worsening economic disputes, and slower demand from China are three key drivers that will dominate a weaker growth outlook in 2019.

Like U.S. equities, Chinese equities struggled in 2018 amid continued trade tensions and uncertainty over the health of the Chinese economy. Trade talks are likely to remain a major focal point in 2019, especially after news that China’s manufacturing sector contracted in December for the first time in 19 months. The S&P China 500 completed 2018 with a loss of 19%. xiv

Elsewhere, the risk of the UK withdrawing from the EU without a trade agreement in place has risen, while domestic political risks will likely continue to weigh on the credit outlooks for Italy, Brazil, Turkey, and Argentina.

Global credit conditions are expected to weaken in 2019 as economic growth decelerates, funding costs increase, liquidity tightens, and market volatility returns. Trade, political and geopolitical risks will likely escalate as tensions between the U.S. and China heighten. In addition, consequences of slower growth will increasingly thrust globalization and inequality debates into the political arena.


Theme 4: The Return of Market Volatility – More Expected in 2019

Volatility has made a comeback in recent months as a litany of concerns from U.S. policy to China-U.S. trade to tightening financial conditions to slowing earnings growth have overwhelmed investors, leading to broad-based, short-term panic selling.

Both monthly index volatility and average constituent correlations for the S&P 500 reached a five-year high, due to higher trading volumes in U.S. equities coupled with December’s decline in liquidity. xv Dispersion among U.S. equities declined during December, with earnings reports largely completed and broader themes dominating sentiment.

In 2018, the S&P 500 exhibited higher volatility, higher correlations, and higher dispersion compared with 2017, with monthly correlations and volatility averaging more than double last year’s levels. In December, the one-month volatility of the S&P 500 spiked to its highest level since 2012, surpassing previous highs in February 2018 and August 2015. xvi More than 40% of trading days in December saw the S&P 500 fall over 1%, triple the historical average. xvii The loss of 2.7% on December 24 for the S&P 500 was the largest percentage decline on the trading day before Christmas ever. This was followed by a 5% gain on December 26, which represented the largest percentage gain since March 23, 2009. xviii It is worth noting that volatility is still nowhere near the levels seen during the heights of the financial crisis.


Section 3. Investment Outlook

Slowing U.S. Growth in the first half of the year, with rising inflation leading to a Recession in the back half of the year

SOURCE: FRAME GLOBAL ASSET MANAGEMENT


Frame Global Asset Management considers these trends and factors them into our outlook for the economy in our twelve-month forward period. We look back to periods of similar economic behavior and use this information to predict the future behavior of the asset classes that we consider. Our investment process allows us to adapt for non-traditional monetary policy and other exogenous variables.


Section 4. December 2018 Portfolio Models

In December, we revised our twelve-month forward outlook to reflect the current counterbalancing influences of inflation on the U.S. economy. We believe that the U.S. is moving toward an inflationary environment that will occur just as growth is slowing. The December Outlook factored in six months of growth followed by six months of inflation over the twelve-month forecast period.

Recent reasons to hope for a more stable global economy in 2019 are contending with reasons to worry. Hope has come from the temporary US-China tariff truce and an oil supply shock that will positively impact global consumer spending next quarter. Concern remains as global geopolitical risks escalate, and the fading benefit of fiscal stimulus combined with tighter monetary policy in the U.S. causes a slowdown in rate-sensitive sectors that will likely spread to the broader economy and beyond the U.S. borders if not addressed. Global business surveys indicate declines in activity in China and softness in most European countries.

In December, we continued to maintain our current asset allocation across all models. This asset allocation is reflective of the current relative attractiveness of interest rates in the U.S. versus the rest of the world.


Deborah Frame, CFA, MBA

President and Chief Investment Officer

January 14, 2019


iInternational Monetary Fund, World Economic Outlook. October 2018.
iiInternational Monetary Fund, World Economic Outlook. October 2018.
iiiInternational Monetary Fund, World Economic Outlook. October 2018.
ivTrading Economics, Canadian Employment. December 2018.
vTrading Economics, Canadian Housing Market. December 2018.
viFederal Open Market Committee Transcripts. 2018.
viiFederal Open Market Committee Transcripts. 2018.
viiiCBO. Monthly Budget Review: Summary for Fiscal Year 2018.
ixCBO. Monthly Budget Review: Summary for Fiscal Year 2018.
xTankersley, Jim & Phillips, Matt. 2018. Trump’s Tax Cut Was Supposed to Change Corporate Behavior. Here’s What Happened. New York Times. November 12.
xiInternational Monetary Fund, World Economic Outlook. October 2018.
xiiADP National Employment Report. January 3, 2019.
xiiiBMO Capital Markets Economics Focus. January 4, 2019.
xivS&P Dow Jones Indices. Index Dashboard: Asia. December 31, 2018.
xvS&P Dow Jones Dashboard, Dispersion, Volatility, and Correlation. December 31, 2018.
xviBMO Capital Markets. US Strategy Snapshot. January 2, 2019.
xviiBMO Capital Markets. US Strategy Snapshot. January 2, 2019.
xviiiBMO Capital Markets. US Strategy Snapshot. January 2, 2019.