Section 1: Q1 2022 Outlook
Global Consumer Prices are Approaching their Fastest Increase of the Past Quarter Century
The COVID-19 pandemic has generated unprecedented macroeconomic volatility and its reverberations will be felt for some years to come. 2020’s lockdowns resulted in the largest drop in global GDP in modern history, which was followed by a re-opening bounce producing the strongest recovery in 50 years.i
Setbacks due to the COVID-19 Delta and Omicron variants have been met by higher natural and vaccine-acquired immunity, significantly lower mortality, and new antiviral treatments. This has occurred in an environment of record corporate liquidity and strong fundamentals that have continued to drive capital investment, inventory re-stocking, shareholder return, and merger and acquisitions activity. Global consumer prices are approaching their fastest increase of the past quarter century.
As economies recover, the stimulus that has been provided by policymakers has led to concerns that a rise in inflation is now embedded. Two unique facts about the nature of the recent stimulus led to inflationary potential. The first is that it has combined fiscal stimulus with central bank asset purchases. The second is the large scale of the two interventions.
Measuring Inflation and its Impact on the Pandemic Economy
The break¬even inflation rate is recognized as the difference in yield between a nominal Treasury bond and the real yield on a TIPS bond of equal maturity. Historically, this difference has also been considered a market measure of expected inflation.
More recently, following the Great Recession of 2008-2010, the information content of the breakeven inflation rate as a measure of expected inflation has been impaired. Unprecedented Quantitative Easing (QE) has been implemented to increase the money supply and encourage lending and investment, through controlled asset purchases by the Fed and other central banks. The action has resulted in engineered low rates that are intended to stimulate demand and consumer price inflation via the traditional channels. Recently, around the globe, in Switzerland, Germany, the Netherlands, Denmark, and Finland, nominal rates have been negative all the way out to 30 years due to the impact of versions of QE in those countries.ii Evidence has shown that quantitative easing, especially in Europe and Japan, has not resulted in the desired economic outcomes or a rise in consumer price inflation to target levels.
One offshoot of the low rate of inflation in advanced economies over the past two decades has been for policymakers to accept greater risks of overshooting their targets. The Fed and Bank of Japan have made this most explicit by setting an average inflation target and an “overshooting commitment”, while the ECB has said its new mandate may imply a period of inflation being “moderately above target”.iii
The level of real rates that keeps an economy growing in line with potential growth and inflation at target, is defined as the neutral real interest rate or r*.iv This neutral real interest rate has been declining across advanced economies over the past 50 years, driven by factors that have increased retirement savings in an aging population and enabled higher savings rates flowing to the wealthy due to inequality (the wealthy tend to have higher savings rates). This has occurred while there has also been a fall in desired investment, driven by the rising importance of less capital-intensive services and, the slowdown in potential GDP growth across advanced economies.
Before the pandemic, r* was far lower than in the past. We saw this during the Fed’s tightening cycle in 2016-18, when the fed funds rate rose to between 2.25% and 2.5% – implying a peak in real rates of only about 0.4% – was enough to engineer a slowdown in economic growth, led by rate-sensitive sectors like residential investment and durables consumption.v
We have observed that when inflation does not rise above a trigger level, real interest rates will not likely rise as high as they have in the past in order to bring inflation back down. There are three key reasons for this.
First, real equilibrium interest rates are currently close to zero across advanced economies, which is much lower than they were before the Global Financial Crisis.
Second, the structural factors that have prevented inflationary pressures from becoming embedded in the system remain at play, including flexible labor markets, labor-saving technological progress, and globalization (even if it is partly rolled back).
Third, policymakers’ new mandates recognize these factors and are less concerned than in the past to bring inflation down.
In a scenario of inflation rising to 3-4%, real interest rates need to rise to 1%. That would imply increases in nominal policy rates to between 4% and 5% if central banks decide they want to return inflation to 2%. In a “worse” scenario in which the inflation rate rises to 5% or more on a sustained basis, real interest rates may need to rise to 2-3%. This would give rise to nominal rates of somewhere in the region of 7% to 9% – levels not seen since the early 1990s.vi And as higher inflation may become more ingrained, they may need to stay there for longer. This scenario would be likely to cause a more significant global downturn, much higher unemployment and pose a risk to the property sector.
Will Inflation be Persistent Post Pandemic?
Potential parallels have been drawn between the current recovery and the so-called “roaring 20s” after the First World War and the Spanish Flu Pandemic. The 1920s was a decade of strong economic growth, with demand fed by loose policy, financial liberalization, and a surge in demand for consumer appliances related to more homes getting electricity. This strong growth was not accompanied by any pick-up in inflation, partly because the 1920s were also notable for their range of productivity-enhancing innovations.
The current environment may be more like the 1960s and early 1970s, when a rise in demand was backed by strong bank lending that led to money growth and to overheating and a rise in inflation. By the mid-1980s, real interest rates in the U.S. were around 4.5% on average in the G7. At the same time, the prevailing level of r* was considered to be about 3%. At that time, real rates were around 150bp above r*.vii
The Fed, Employment, and Inflation
The Phillips curve is an economic concept developed by A. W. Phillips stating that inflation and unemployment have a stable and inverse relationship. In spite of the failure of the relationship to hold true in recent years, the Philips Curve remains the primary model through which the Fed understands inflation. The theory claims that with economic growth comes inflation, which in turn should lead to more jobs and less unemployment.
The Fed has a dual mandate by which it aims for full employment as well as price stability, and it now aims to minimize “shortfalls” from its employment goal. The Fed could keep monetary policy loose even if inflation is slightly above target if it judged that it has not reached full employment.
For much of 2021, the Fed was content to view inflation developments as transitory. If post-pandemic dislocations such as further delays in China’s reopening, supply chain issues and labor shortages persist, inflation may become persistent.
In the U.S., the labor market has tightened faster than expected. This is occurring as the Fed’s full employment goal—the last remaining condition for liftoff—is in sight. Support to pricing may now be pivoting to a tightening labor market that is pushing up wages, business costs, and business output prices.
Global Balance Sheets and Combined Fiscal and Monetary Stimulus
Has the pandemic shown inflation to be a fiscal phenomenon?
A decade of QE did not cause much inflation. Fiscal stimulus has sent it soaring. While central banks, not governments, are charged with hitting inflation targets, does the experience of the pandemic show that current inflation is fiscal spending induced?
Aggressive fiscal policy stimulus was a key catalyst of the recovery. The rise in fiscal deficits has dwarfed the size of those seen after the global financial crisis. In the U.S., this has resulted in the biggest ever peacetime deficit.viii This was particularly the case in 2021, when cash injections from central banks were at record monthly levels. After consistently dismissing the threat of inflation, the Fed’s “better late than never” pivot on the issue is part of a general shift in global central banking towards less monetary policy stimulus.
In the 2010s, central banks created vast amounts of money through their QE schemes, while governments enacted fiscal austerity. Inflation in the rich world was mostly too low, undershooting central banks’ targets.
Then the pandemic struck and there was plenty more QE. In combination, economic policy stepped up with the $10.8 trillion in fiscal stimulus implemented worldwide, equivalent to 10% of global GDP.ix The result has been high inflation. The tsunami of fiscal stimulus was accompanied by bond-buying of almost equal magnitude: central banks in America, Britain, the Eurozone, and Japan have together bought more than $9trn in assets. The result has been a surge in deposits at commercial banks.
Our view is that this version of fiscal stimulus leads to more spending. In combination with QE, the central bank creates new money with which it buys the bonds that the government has given out. When everything is netted, the government is not giving out bonds. It is giving out cash. Is this version of expanding combined supply proving to be inflationary?
In the U.S., the rich country that has splurged the most, deposits have risen from around $13.5trn in early 2020 to around $18trn today.x Not by coincidence, the U.S. has also had the most inflation. With consumer prices rising at an annual pace of 7.0% in December, the Federal Reserve on December 15th was forced to acknowledge that inflation had become a serious threat.xi
The current approach that combines monetary and fiscal stimulus is unique in history. One way in which fiscal stimulus boosts inflation is by strengthening households’ and firms’ balance-sheets, making them more likely to spend. When the government raises cash from investors, they receive bonds in exchange. The government then hands out the money to households, returning it into circulation. Netting off, it is as if the government has just given out new bonds. Whether those bonds constitute new wealth for the private sector is the subject of a theoretical debate. When the government runs up debts the public could also expect to pay higher taxes in the future—a liability that offsets their newly created assets.
Investors value government debt, especially America’s, for its liquidity, meaning they are willing to hold it at a lower interest rate than other investments—much like the public is willing to accept a low yield on bank deposits. But, while its policy stance will remain accommodative for quite a while, the world’s most powerful central bank is now set to completely stop its asset purchases by the end of the first quarter of 2022. An increasing number of other central banks (not only in the emerging world but also in some advanced economies such as Norway and the U.K.) have already embarked on interest rate hiking cycles.
If money and debt are substitutes, their combined supply can be powerfully inflationary. David Andolfatto of the Federal Reserve Bank of St. Louis wrote in December 2020, “it seems more accurate to view the national debt less as a form of debt and more as a form of money in circulation.” He also warned Americans to “prepare themselves for a temporary burst of inflation” in light of the one-off increase in national debt during the pandemic.xii
2022 Global Inflation Outlook
A sustained surge in inflation has not been experienced across advanced economies during the past three decades. As the inflation risk increases in the post-pandemic world, investors have little practical experience of how to position their portfolios during such times. A critical element in the inflation outlook will be the confidence among consumers and investors that inflation will be managed and controlled successfully as we move out of the pandemic environment.
Risk of a demand-induced inflation looks greatest in the U.S. The policy stimulus there has been especially large, fiscal policy remains loose and output is already much closer to its pre-crisis trend than in other countries. There is less chance of strong demand fueling inflation in Japan and the Eurozone, where the economic recovery is likely to remain slower and the relationship between demand and inflation is weaker.
The 2022 global economic recovery is moving forward with limited slack, particularly in the Developed Markets. Less than three years into the expansion, the global output gap is likely to close in early 2023. While December’s 2021’s 7.0% surge in consumer prices is not expected to be sustained, the combination of limited slack, above-potential growth, and gradual monetary policy normalization points to Developed Markets core inflation settling higher than its pre- pandemic norm.
Markets will no longer have liquidity injections to power them through uncharted and choppy economic waters. Investors will have to take a view on the durability and impact of the inflation surge, including the drivers of its eventual demise. For more than a decade, large-scale central bank purchases of assets boosted not just those being bought in markets but also virtually all other assets, including financial and physical (such as housing, art, and other collectibles).
Tighter financial conditions will continue to feed a combination of financial instability and lower private demand. In its extreme, stagflation policies become a lot less effective at a time when markets are dealing with underpriced liquidity, credit, and solvency risk. Inflation would eventually come down in this scenario through a process that leads to a drop in economic activity.
The combination of strong economic growth, aggressive fiscal and monetary stimulus (comparable only to the post-WWII accommodation), pent-up demand, and supply-chain bottlenecks have triggered an inflation pick-up to levels not experienced for decades. We will monitor key inflation indicators and consumer and investor sentiment.
U.S. Inflation Hit Another ~40-Year High
U.S. Consumer Price Index: Year-over-Year Change (%)
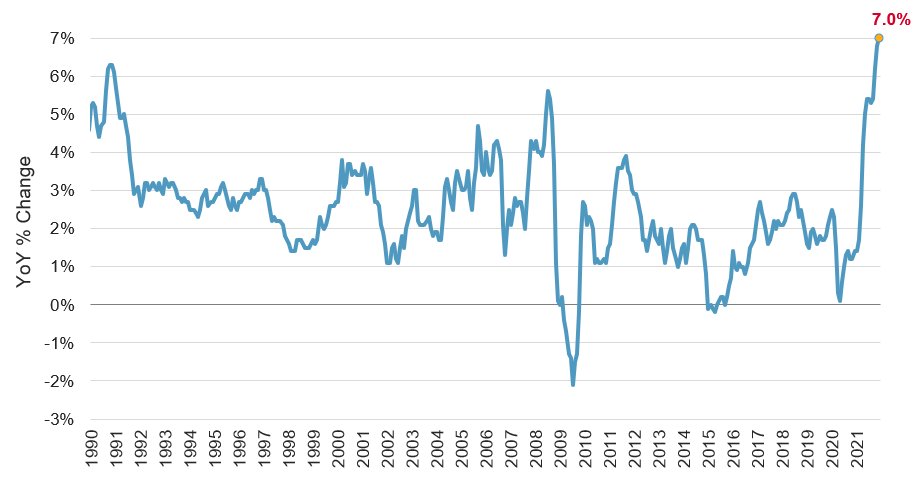
SOURCES: S&P DOW JONES INDICES, U.S. BUREAU OF LABOUR STATISTICS, BLS DATA AS OF JANUARY 12, 2022.
U.S. Inflation Indicators
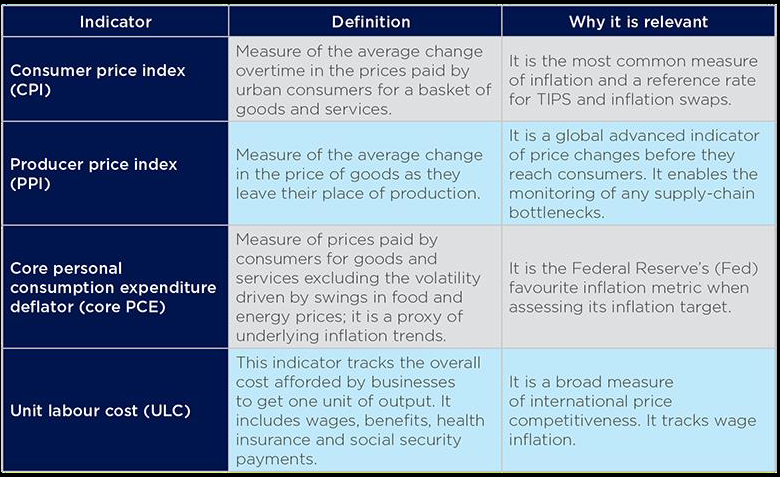
SOURCE: AMUNDI RESEARCH AS OF DECEMBER 2021. TIPS: TREASURY INFLATION PROTECTED SECURITY.
Section 2. Four Themes
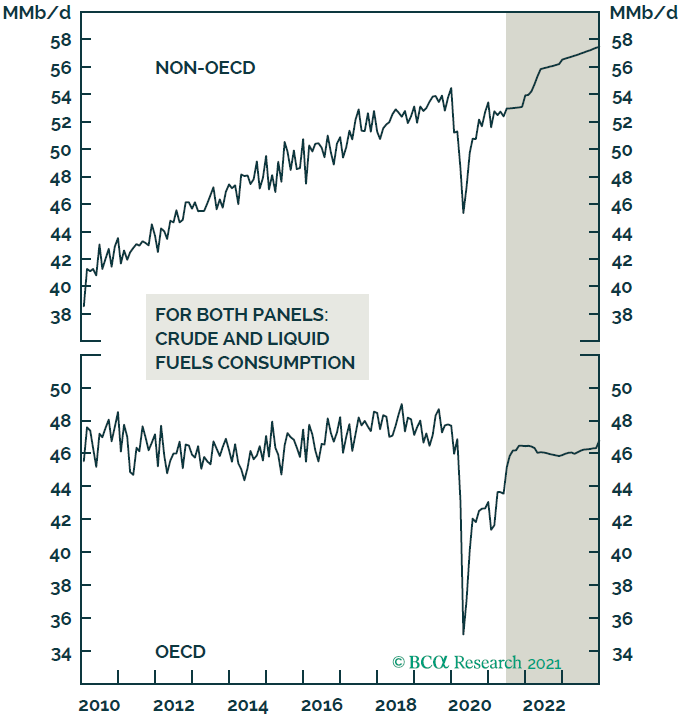
Theme 1: Energy Prices Drive Global Inflation
There are symptoms of dysfunction in global energy markets. Early in 2022, oil prices in the U.S. have hovered above $80 a barrel, their highest level since late 2014. Natural-gas prices in Europe tripled in 2021. Demand for coal has surged. Power cuts in China, coal shortages in India, and spikes in electricity prices across Europe are the collateral damage.
A few years ago, producers of fossil fuels would have responded to such price signals by swiftly ramping up output and investment. In 2014, with crude above $100 a barrel, Royal Dutch Shell, a European supermajor, put more than $30 billion of capital expenditure into upstream oil and gas projects.
Not this time. Climate change has led to unprecedented pressure on oil and gas firms, especially European ones, to shift away from fossil fuels. As part of Shell’s long-term shift towards markets for lower-carbon gas and power, its upstream capital spending this year has shrunk to about $8 billion.xiii
As the pandemic eases, the oil market could reach a point of lacking any spare capacity, according to Goehring & Rozencwajg, a commodity-investing firm.xiv That might be only a temporary state of affairs; Aramco and ADNOC could respond rapidly. But temporarily at least it would push prices of crude sharply higher, adding further strains to economies already suffering from soaring costs of natural gas for homes and energy-intensive activities, from steelmaking and fertilizer production to blowing glass for wine bottles.
Theme 2: Labour Shortages Begin to Drive U.S. Inflation
Labour markets have continued to recover as economies have reopened.
There is mounting evidence of labour shortages intensifying across Developed Markets with the most acute shortages in the U.S. and the U.K. Job vacancies have also increased, and are now well above pre-pandemic levels in Australia, the U.S., and U.K. And while the rise in vacancies is good news to the extent that it reflects strong demand for labour as economies recover, it also suggests that firms are finding it hard to fill positions and could lead to some upward pressure on wages.
Unlike in the U.S., the Eurozone labour market has some spare capacity. And in the U.K., the fact that sectors with the most vacancies are those with the highest share of workers previously on furlough, suggests that there should be less labour market friction as those workers seek employment. A rate hike in the back half of 2022 may be confirmed at the next month’s FOMC meeting.
Theme 3: China Growth Restrained
China’s relationship with the United States and the global economy is a critical factor that has the potential to dramatically shape economic growth and investment opportunities, not only in China but globally. While China’s economy managed to outperform its peers during the early months of the pandemic, it now faces major challenges over the near term as deleveraging and policy tightening restrain growth.
While the government has made some progress in controlling shadow banking, it is aware of additional work needed to properly address financial stability risks, especially amid mounting bankruptcies, including state-owned enterprises. Ultra-loose lending facilities of earlier years, coupled with large government deficits and borrowing during the pandemic, caused debt to explode. According to the Bank for International Settlements, non-financial sector domestic debt rose from 239% of GDP in 2015 to reach 290% of GDP at the end of 2020, the increase driven in large part by corporations (which includes state-owned enterprises).xv Deleveraging has become a priority. The government is now willing to accept slower but more sustainable growth. Real estate property developers, for instance, are facing more stringent borrowing conditions, and that has already led to a significant slowdown in loan growth in the construction sector.
Over the longer term, the alteration of global value chains in the aftermath of the pandemic, geopolitical tensions with Western democracies, the relationship with Hong Kong and Taiwan, carrying the Belt and Road Initiative to fruition, an aging workforce, and declining productivity all represent serious challenges for China. The central government is hoping to address some of those with the implementation of its five-year plan, a focus on supporting “home grown” domestic demand. U.S. concerns about China’s respect for intellectual property and other international trade laws, as well as concerns about China’s increasingly aggressive foreign policy, have been escalating since Xi Jinping became president in 2012. Viewing China’s recent actions as a response to actions initiated by the Trump administration seems to overlook the larger context.
Theme 4: Fed Policy Support for Risky Assets Ends
The Fed has supported keeping “risk-free” rates low, while also continuing to provide direct support to competing risky assets. These purchases are intended to lower long term interest rates and prod investors into investments that would spur growth.
The original policy began on March 23rd, 2020, when the central bank announced that two corporate bond facilities would be established – a Primary Market Corporate Credit Facility (PMCCF) for new bond and loan issuance, and a Secondary Market Corporate Credit Facility (SMCCF) to provide liquidity for outstanding corporate bonds.xvi
The facilities were enhanced on April 9th, 2020. Changes included i) increases in the Treasury’s equity investments, to $50bn for the PMCCF and $25bn for the SMCCF; ii) a broadening of participation to include “fallen angels” that had been investment-grade on March 22nd; iii) a clarification of the maximum leverage ratios of the SPV: 10:1 for investment-grade and 7:1 for sub-investment-grade bonds; and iv) the inclusion of some high-yield bonds in the SMCCF’s purchases of ETFs. Finally, the SMCCF was tweaked again in June 2020. That facility is now also able to purchase in the secondary market eligible corporate bond portfolios that track a broad market index.xvii
In June of 2020, the Fed announced its decision to tweak its policy again, to provide support to the corporate bond market following the outbreak of COVID-19, buying corporate bonds in the secondary market, and thus feeding further gains in the prices of equities.
In November 2021, fed officials laid out a plan to slow their $120 billion in monthly Treasury bond and mortgage-backed security purchases by $15 billion a month starting in November.xviii
Section 3. Investment Outlook
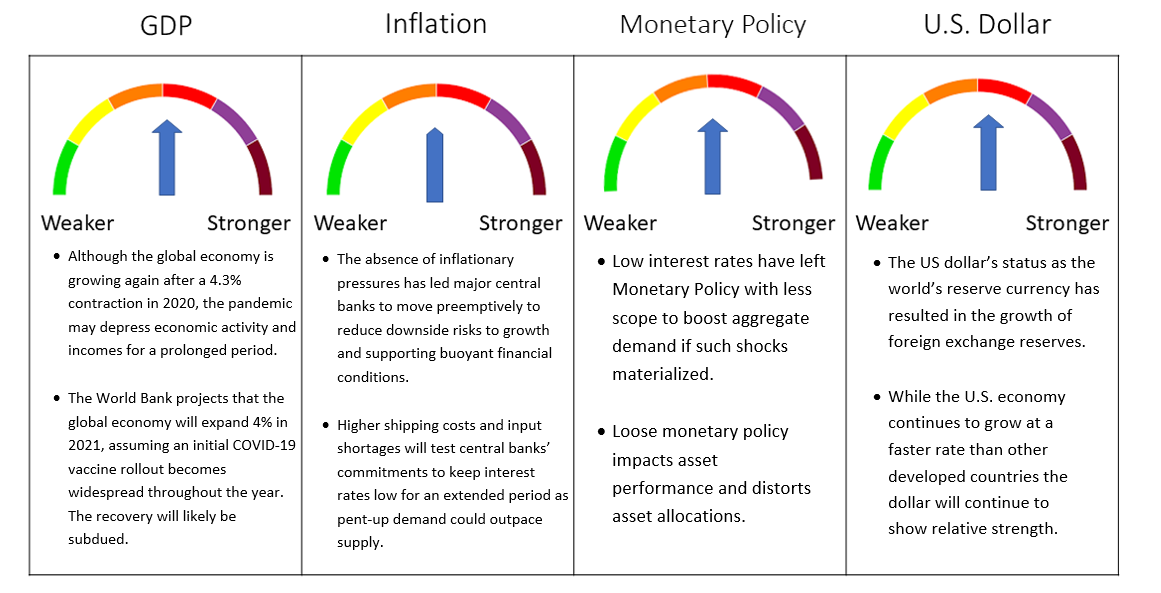
Global Pandemic Leads Us to a Growth Forecast for the Next Twelve Months while we Continue to Closely Monitor the Outlook for Inflation.
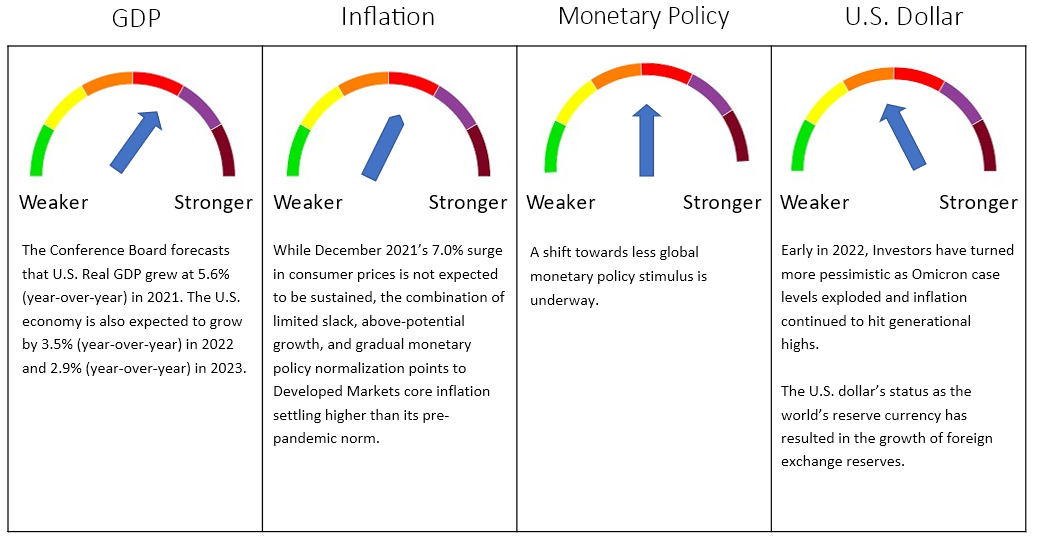
SOURCE: FRAME GLOBAL ASSET MANAGEMENT
Frame Global Asset Management considers these trends and factors them into our outlook for the economy in our twelve-month forward period. We look back to periods of similar economic behavior and use this information to predict the future behavior of the asset classes that we consider. Our investment process allows us to adapt for non-traditional monetary policy and other exogenous variables.
Section 4. December 2021 Portfolio Models
One year after the launch of anti-Covid vaccines, financial markets have been willing to move beyond the pandemic while the economy has not. We see this with the disruptions among supply chains, particularity labor and commodity markets. The longest economic expansion in American history – 128 months – has been followed by the shortest recession – 2 months – and has registered the sharpest rebound ever measured. Inflation continues to be fed by supply shortages, labor costs, worker shortages, and consumers, who are responding to the changes imposed by the pandemic. In December, we maintained our twelve-month forecast of Growth (U.S. GDP greater than 2.5%) through the period while we continue to closely monitor the outlook for inflation.
We maintained our Asset Allocation across all models in December. Corporate earnings across all market caps were solid in Q3. U.S. fiscal spending that will fund local governments in the pending infrastructure bill supports our exposure to short-term treasuries and municipal bond exposure in the U.S. We believe that raising rates too early in 2022 during a transitory inflation environment will not occur for risk of causing a recession.
The global economic recovery is moving forward with limited slack. Against the backdrop of an incomplete recovery and a significant buildup of public sector debt, we have lowered our growth recovery expectations while maintaining our outlook to above 2.5% GDP growth in the U.S. over the next twelve-months.
Deborah Frame, CFA, MBA
President and Chief Investment Officer
January 14, 2022
iTrading Economics. U.S. Market Return. 2020 and 2021.
iiTrading Economics. Nominal Interest Rate by Country.
iiiTrading Economics. ECB Inflation Target. January 7, 2022.
ivBrookings/Hutchins Centre. Neutral Interest Rate. October 2018.
vFederal Reserve. Open Market Operations. 2016 to 2018.
viTrading Economics. Nominal Interest Rate by Country.
viiTrading Economics. Nominal Interest Rate by Country.
viiiTrading Economics. U.S. Budget. December 10, 2021.
ixInternational Monetary Fund. Covid-19 Global Fiscal Response. November 2021.
xInternational Monetary Fund. Covid-19 Global Fiscal Response. November 2021.
xiTrading Economics. U.S. Fed Funds Rate. December 15, 2021.
xiiDavid Andolfatto. Federal Bank of St. Louis. December 2020.
xiiiThe Energy Shock. The Economist. October 16, 2021.
xivThe Energy Shock. The Economist. October 16, 2021.
xvTrading Economics. China Non- Financial Debt. 2020.
xviU.S. Federal Reserve. March 23, 2020.
xviiU.S. Federal Reserve. June 2020.
xviiiiU.S. Federal Reserve. November 2021.