Section 1. Q2 2019 Outlook
Multiple Factors Raise the Prospect of Risk Asset Volatility
As we look forward to the second quarter of 2019, we expect to experience greater volatility.
Capital around the world moves to markets where it sees the greatest opportunity and to escape other relatively riskier international environments. The U.S. is the largest economy and the largest democracy in the world, and its importance relates to its dominant role in global macro policy setting and driving financial conditions. This is largely driven by relative interest rates, currency differentials, and perceived safety/risk. Common sources of macro risk including the Fed, energy prices, geopolitics, inflation shocks, regulatory change, sovereign risk, elections, and fiscal-policy dysfunction can affect both single stock volatility within an asset class and the correlation among stocks and bonds. i
Volatility in equity markets around the world has reinvigorated debates about its root cause, as has the recent reversal. After the significant drawdowns and large price swings in risk assets in late 2018, volatility dropped sharply, and returns were positive. The S&P 500 rebounded 13.6% during Q1 as interest rates declined in the United States. ii Why this reversal and reduction in volatility has come about is the focus of our current outlook.
Studies confirm that there is a direct link between macroeconomic and geopolitical uncertainty, and volatility and correlations within markets and asset classes. In our Q1 2019 Outlook we highlighted the focus on downside risks both domestically and globally in the markets and in the broader economy.
A negative feedback loop had emerged, centered in the U.S., linking bad policy choices to falling asset prices, tighter financial conditions, and weaker corporate earnings. One of the principal drivers to the sell-off in risk assets in the latter part of 2018 was the fear of a policy mistake by the Federal Reserve and by the unexpectedly hawkish rhetoric of key Fed officials. A more dovish and growth supportive Fed has emerged in 2019, driven primarily by the Federal Reserve’s more dovish rhetoric regarding both further interest rate rises in the U.S. and reversal of its quantitative easing program and the progress on U.S./China trade.
In March, the U.S. Fed’s Beige Book reported a slight increase in growth, as the negative impact of the government shutdown was seen in autos, restaurants, and manufacturing, where consumer spending was slow. iii The Fed met and stayed pat, leaving its interest rates unchanged, as expected, and signaled that there would be no additional interest rate increases for 2019, and that it would end its balance sheet reduction in September.
Despite this, we expect higher volatility to be present for the remainder of 2019. The array of outcomes for key macroeconomic variables is broadening as the U.S. cycle matures. This suggests that the overall volatility regime should be higher across assets as investors demand a higher risk premium for the increased uncertainty.
On the geopolitical front, does progress on trade talks between the U.S. and China negate the likely influence of geopolitical risk across markets over the medium term?
Not in our view.
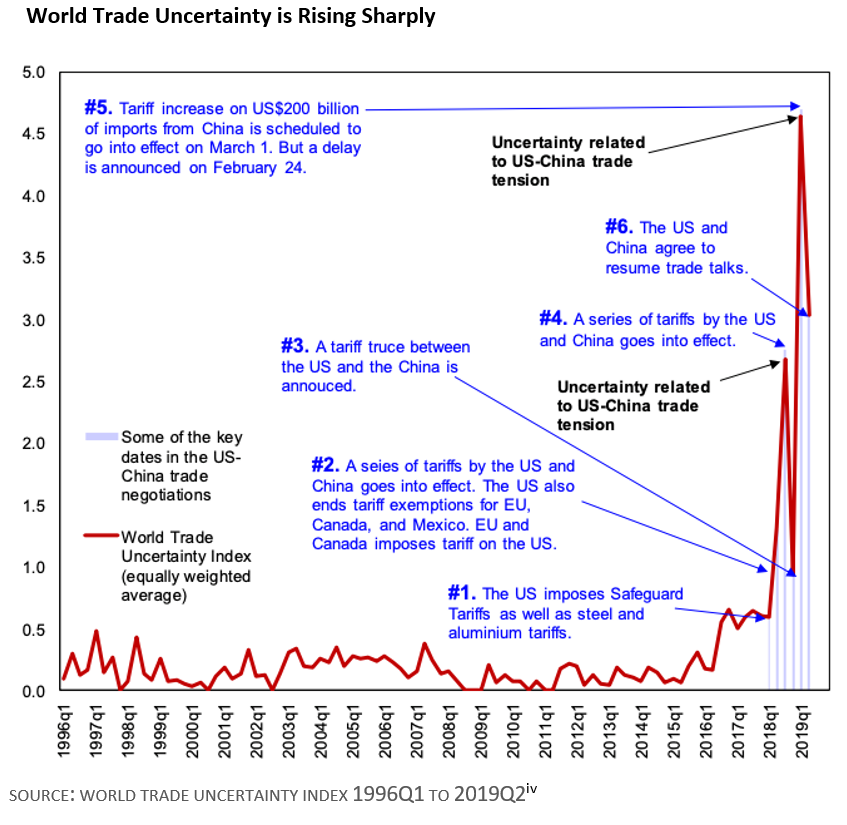
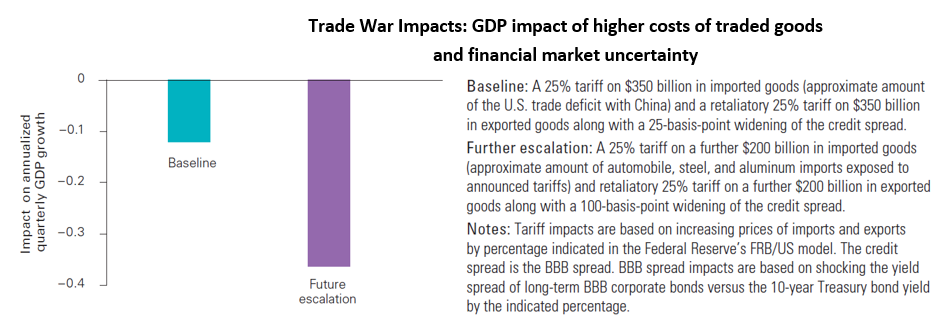
The current trade war between the U.S. and China has already hurt business confidence and weighed on growth. While recent discussions between the two countries appear to have been more constructive, behind the recent headlines are deep seated issues regarding geopolitical influence, national security, and technological intellectual property. In our view, these are very unlikely to be resolved, even if U.S. tariffs on Chinese goods are lifted.
Heightened geopolitical risks are embedded and likely to impact multiple asset classes for the foreseeable future. The forces of protectionism and populism are deeply entrenched. Risks remain elevated with the Brexit outcome still uncertain, upcoming elections in the European Union, and the leadup to the U.S. 2020 presidential election campaign. The current U.S. administration is unpredictable and the risk that President Trump follows through with tariffs on European auto exports as a result of its Section 232 investigation, and that he continues to be unpredictable in all aspects of international diplomacy, are very real. iv
We focus on minimizing capital losses by recognizing macro and geopolitical risks that are present and expected over our forecast time horizon. The Frame Global Asset Management investment process monitors the global movement of capital into and out of the United States. Few investment models are centered on the movement of capital into markets driven by the macroeconomy. Markets are forward looking, and when we look at the behavior of markets, we see that they eventually reflect the reality of the current and anticipated future macroenvironment. Our investment process incorporates this eventuality. Traditional investment managers are handicapped when their portfolios are “macroeconomic regime” agnostic. We make extensive use of our internal expertise in interpreting economic data. In executing our process successfully, we exploit these inefficiencies and provide our clients with superior outcomes as we focus on minimizing capital losses.
We recognize that aversion to loss is rooted in a current, ongoing, or future need for income as well as an expectation that the value of the investment will be recovered at a future point in time. The lower yield environment that has existed since the global financial crisis in 2008 has also created a greater awareness of the challenges to attaining income goals.
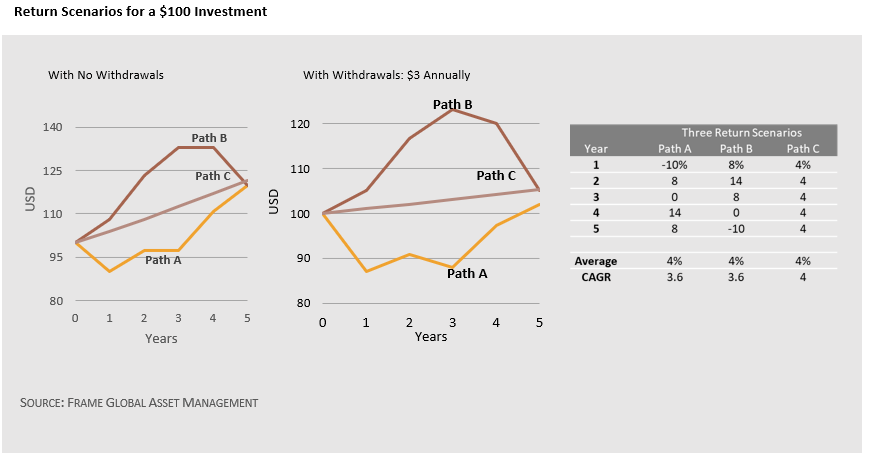
While much attention is paid to asymmetrical pain suffered when experiencing losses compared to gains of the same amount, the reality is that mathematics creates real differences in loss outcomes. A loss of 50% requires a recovery in dollars equal to 100% to make up the lost ground. It is not merely a feeling; it is a real hit to wealth and a hit to the ability to recover on a reduced asset base. Percentages create a sliding scale of absolute dollar returns as the base on which the percent is applied moves up and down, above and below the original investment value. While time may help in recovering from early in the investment period losses, the withdrawal of income along the way has a significant impact on the ability of the investment to grow, particularly when the hits to growth occur early in the investment period. In the most basic sense, the problem comes from differences between steady timing of withdrawals and the unpredictable swings in the fund’s investment value (see graph below).
We believe that multiple factors across the developed world raise the prospect of risk asset volatility as global growth slows down in the second quarter of 2019. High volatility increases the chances that you will be taking money out when the portfolio is down, forcing you to lock in your losses. The impact can be particularly damaging if the downturn happens early in the withdrawal period.
We will be monitoring these risk factors and adjusting our portfolio models to protect you from this risk.
Section 2. Four Themes
Theme 1: Slowing Global Growth
After the synchronized growth of 2017, the rate of acceleration in global economic growth has moderated quite significantly over the past year. The best explanation for the slowdown in global growth is that country-specific problems have started to weigh on activity in the world’s three major economic regions, the U.S., China, and Europe, and have then been amplified through various feedback loops. In addition, it’s possible that political uncertainties are beginning to weigh on business investment in some countries, especially those in Europe.
While it is common for global downturns to have their roots in several different areas, the current situation is unlike the last downturn in 2008-09 which was unusual both because of its size and because it had a single cause (debt and housing).
The World Trade Organization said global trade shrank by 0.3% in the fourth quarter and estimates will grow by just 2.6% in 2019, down from 3% in 2018. v Global GDP growth has slowed from 3.8% year over year in the first quarter of last year to around 3% year over year currently. Though that may not seem significant, the IMF has previously suggested that a figure below 3% constitutes a global recession. vi So this is serious.
The major driver of the slowdown is the lagged impact of tightening financial conditions globally and trade tensions impacting business sentiment and investment. Momentum across recent macroeconomic data releases for major economies has been clearly negative with little sign of durable stabilization.
At a sectoral level, manufacturing has borne the brunt of the downturn, resulting in a sharp decline in global trade. In contrast, the service sector has been relatively resilient.
The U.S. economy has held up relatively well so far, but the monthly activity data and business surveys are now pointing to a more marked slowdown in growth in 2019. The relatively high quality of U.S. data releases further enhances its importance as emerging global impulses are often identified most clearly in the Unites States.
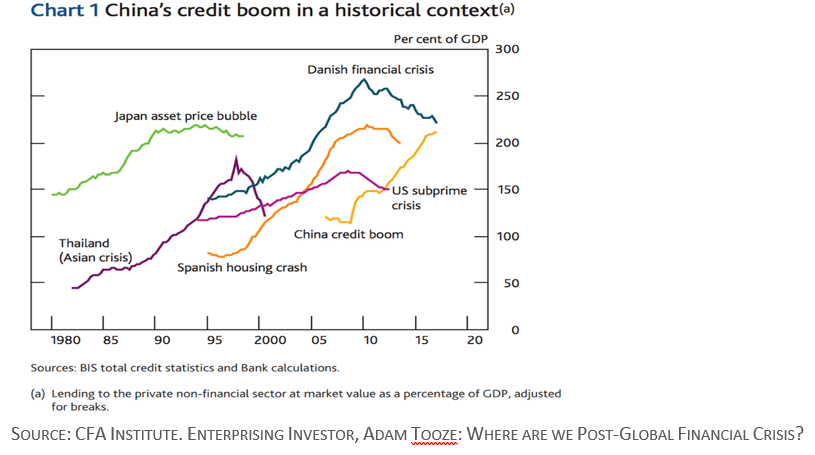
While China’s economy is smaller and its data releases are more difficult to read, its outsized contribution to global growth and its central role in global supply chains has enhanced its importance in global data watching. There is a series of thematic trends driving China’s economy in the future, including the rebalancing of global capital toward Chinese markets, data-driven innovation, industrial upgrading, sustained growth in the consumer sector, and the reorienting of China’s trade relationship. The last ten years of stimulus and deleveraging is a story of “eight-plus-two.” Eight years of government stimulus after the global financial crisis, followed by a couple years of conscious deleveraging and credit reduction. Since 2016, regulators have acknowledged growth challenges and emphasized deleveraging. The government’s crackdown on shadow banking and peer-to-peer lending, including arrests of executives, is having an additional dampening effect on the flow of credit. This has led to a significant drop in credit availability over the past 24 months. Growth in outstanding credit fell to 7% in 2018 from 13% in 2017, below nominal GDP growth of 9.7%. vii
There is now evidence of cooling of Chinese GDP growth, especially since the middle of last year, and sales of cars and smartphones have been dropping steeply. Some high-profile companies are flashing warnings of plunging sales and some even of job cuts. The pain is felt in broader Asia as well, home to some of the world’s most export-reliant economies. The McKinsey Global Institute’s Economic Activity Index, which tracks the performance of the Chinese economy using a basket of 57 different indicators ranging from retail and property sales to electricity consumption, measures the dipping trend line in China’s official GDP numbers. viii
Despite the doom and gloom, China continues to demonstrate one of the strongest growth rates in the world, adding the equivalent of “another Australia” each year. Consumers continue to trade up to more expensive premium goods and some companies are registering record sales. China’s effort to rebalance the economy toward consumption and services contributed about 76% and 60% of its GDP growth, respectively. ix
We also know that the slowdown has been particularly severe in Europe. Europe is not as large as the U.S. and does not contribute to global growth as much as China, but Europe’s latest political and economic news raises the risk that it will be the source of a significant negative global shock this year.
While the ECB said that it will start its third program to stimulate bank lending to counter a softening economy and that it would hold rates low at least through 2019, these programs have been contributing to greater macro-policy lead volatility.
The Western European economy comprises over 20% of global GDP and becomes a central driver of the global business cycle when it experiences a significant idiosyncratic shock. This was the case during the European sovereign crisis in 2011-13, while Europe’s acceleration in 2016-17 was a key contributor to strong synchronized growth phase. x
Looking to the U.K., the recent descent of U.K. politics into chaos raises a global threat. It is increasingly difficult to see the U.K. navigating through this mess without a general election. However, both the Conservative and Labour parties are being led from extreme positions, and it is unclear that an election will result with the consensus needed to forge a deal. Although the EU Council of Ministers threat of a “no deal” deadline to force the U.K. into making quick decisions will likely be relaxed in the event of a general election, uncertainty will linger and weigh on U.K. and EU growth.
We continue to monitor global growth.
Theme 2: Inverted Yield Curve and Recession Risk
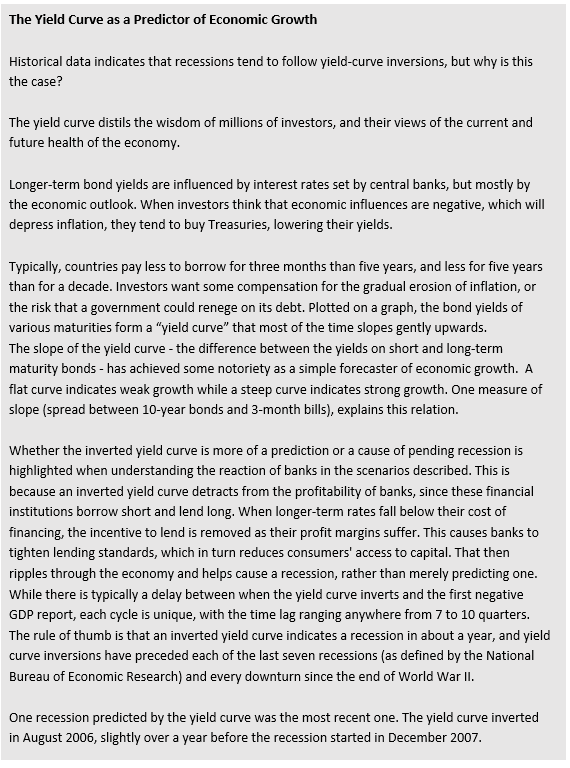
Equity market corrections don’t have a great history of predicting recessions but yield curve inversions have been more reliable. In fact, since 1977, every yield curve inversion has been followed by a period of economic contraction, measured by GDP. xi
On March 20, the Fed announced that it would keep rates unchanged, holding its policy rate between 2.25% and 2.5%. xii In addition, the central bank alluded to no more rate hikes for the rest of 2019 after initially forecasting two. The central bank has been on a path towards asset reduction, which they say would come prior to the end of 2019. Following the Fed announcement, on March 22, the U.S. yield curve inverted with the 10-year Treasury yield dipping below the 3-month T-bill yield for the first time since 2007. The inversion lasted five trading days and then tipped positive again. Combined with the length of the post-crisis expansion and deteriorating economic data, the inverted yield curve has stirred fears that the countdown to the next downturn has already begun.
Post-crisis regulation encouraged banks to keep more money in ultra-safe assets, and it is hard to find anything safer than U.S. Treasuries. The Fed is still sitting on $3.7 trillion of Treasuries held prior and acquired through bond-buying programs, while negative interest rates and quantitative easing programs in Europe and Japan have nurtured demand for highly rated debt. xiii Combined with secular forces such as technology and demographics that keep inflation low, longer-term yields are expected to be kept down.
Complicating the issue is that the U.S. government is financing much of its budget deficit by issuing short-term bills rather than longer-term bonds. We expect that the recently shrinking Fed’s balance sheet and interest rate increases will continue to exert upward pressure on Treasury bill yields. We may prefer to look at the 2-year and 10-year Treasury yields as a cleaner measure of the curve’s shape. This spread has remained positive. The 2-year and 30-year spread, another popular measure, has steepened this year, muddying the yield curve’s signal. Japan, the U.K., and Germany have all seen inversions in the past without suffering recessions. However, this does not negate the signal the yield curve is sending.
We will continue to monitor the yield curve along with other signs that this economic cycle is in the latter stages: slowing global economic activity, soft earnings growth, and historically high corporate leverage.
Theme 3: The Role of Gold When Investors Seek to Minimize Drawdown Rather than Maximize Performance
There are now broad-based signs of slower growth in most major economies, including the U.S., the Eurozone, Japan, and China. In a contraction, the best performing asset classes are cash, government bonds, and gold.
Investors embraced gold for six months up to February of this year. The price of gold rose 14% from August 15, 2018 to February 20, 2019, as economic uncertainty and heightened volatility dominated markets. xiv Since then volatility has declined, putting a damper on gold prices at the end of February.
While no clear evidence points to an immediate positive impact on the price of gold after the Fed pauses, gold did move up during the days when the yield curve inverted in March. Historical analysis suggests that gold eventually reacts positively as the pause cycle extends and/or the Fed eases monetary policy. Historical post-tightening periods have shown an eventual strong gold performance, counterbalancing the performance of risk assets such as stocks or commodities, and complementing assets such as Treasuries and corporate bonds.
Gold consumption has seen geographical changes over the past decade. Gold demand seems to have moved ‘West to East’ as emerging markets have become larger consumers of gold. China and India currently make up over 50% of global consumer demand while the U.S., Western Europe, and Japan have become less significant consumers. xv
The 2008 crisis prompted a change in central bank behavior. Sales by Western central banks were more than offset by gold purchases by emerging central banks, whose reserves increased strongly due to their external surpluses linked to their rising share of global trade (China in particular) as well as rising commodity prices (Russia). The major buyers of gold since 2000 among central banks have been large emerging countries such as China, Russia, India, and Turkey. xvi
Over 20 central banks added gold to their foreign reserves in 2018, some after multi-year absences. In a recent survey by the World Gold Council, 76% of central banks viewed gold’s role as a safe haven asset as highly relevant, while 59% cited its effectiveness as a portfolio diversifier. Additionally, almost 1/5th of central banks signaled their intention to increase gold purchases over the next 12 months. xvii
Many Emerging market central banks have continued to diversify their exposure to US dollars, and gold has been a key beneficiary. European central banks who have bought gold include Poland, Hungary, Russia, Kazakhstan, and Turkey. The desire to de-dollarize foreign exchange reserves, in response to deteriorating geo-political relations in some parts of the world, motivated purchases. Other central banks bought gold for diversification and, in Hungary’s case, partly as a hedge against structural changes in the international financial system.
We model gold as an asset class and will be watching the economic conditions that benefit gold as we move through 2019.
Theme 4: The U.S. Dollar Role as Reserve Currency
By the end of the 20th century, the US dollar was considered the world’s most dominant reserve currency. The world’s need for dollars has allowed the U.S. government, and Americans, to borrow at lower costs. Any change in confidence in the U.S. currency, due to economic and political factors, impacts the strength or weakness of the dollar.
During the first quarter, the U.S. dollar appreciated slightly with the U.S. Dollar Index (DXY) rising 1.2%. The euro declined 0.2%, the yen declined 1.1%, and the Brazilian real declined 1.0% against the U.S. dollar, while the Canadian dollar was up 2.2% and the Mexican peso was up 1.1% against the dollar. xviii
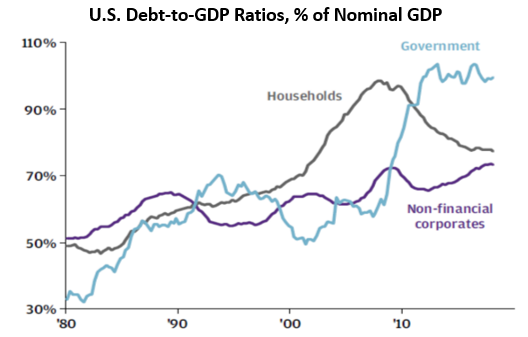
Continuing the trend since 1971, rising private and public debt is a source of structural U.S. current account deficits, which may eventually translate into dollar depreciation. The US dollar experienced a 2.85% average annual depreciation against gold (from $35/ounce in August 1971 to the $1,282/ounce level observed as of the end of 2018). xix
In the first quarter, the trade-weighted index was down only 1%, with depreciation against only one-third of G10 currencies while depreciating against two-thirds of EM ones. xx Over the past 25 years, both blocs have either appreciated against the dollar (32% of quarters) or appreciated (45%). It’s unusual for these two blocs to move in different directions. This year, the dollar has gained against most major currencies but declined against most EMs. Strong country-specific influences outside the U.S. explain this anomaly.
Currencies are a relative price; typically driven by relative growth and relative monetary policy rather than the U.S.’s absolute fundamentals. Correlations between Fed policy and the dollar are more difficult to predict, explaining why U.S. equity strength can occur alongside both a strong dollar (31% of instances) and a weak dollar (37% of instances). xxi The dollar is behaving as expected by declining with yields, even if the pairwise performance is quite mixed given that many non-U.S. economies have experienced more disappointing growth and greater declines in yields this year.
We will be watching this potential de-correlation within currencies as non-U.S. conditions change.
Section 3. Investment Outlook
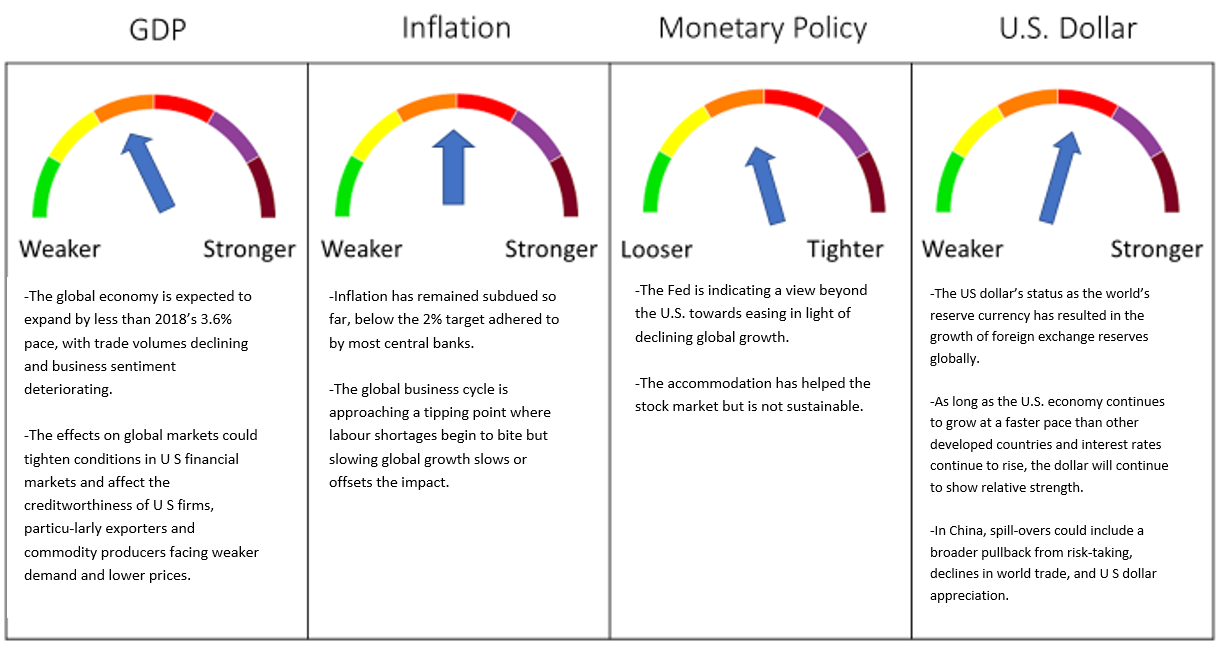
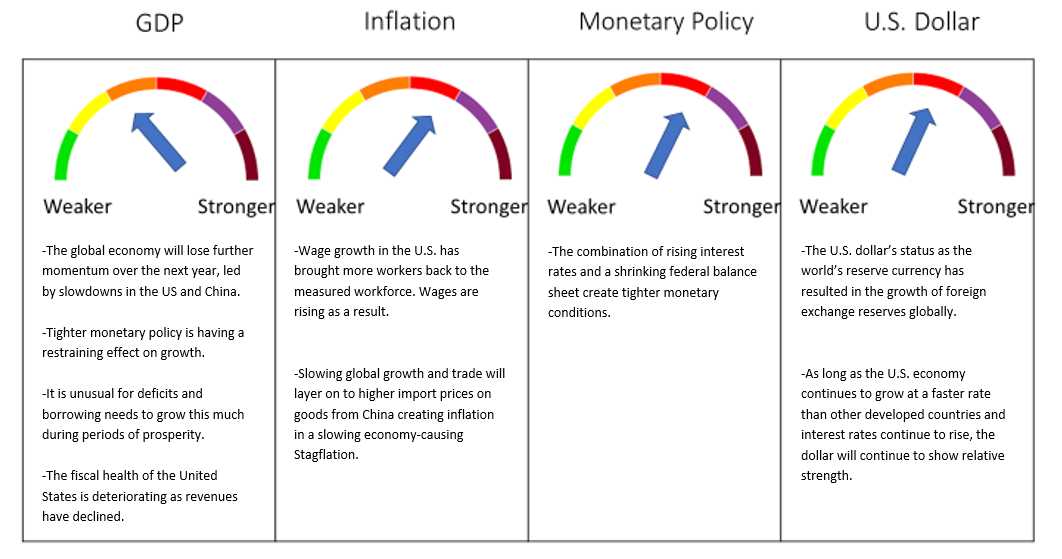
Slowing Global Growth While the U.S. Fed Pulls Back on Tightening Leads Us to a Stagnation Forecast for the Next Twelve Months
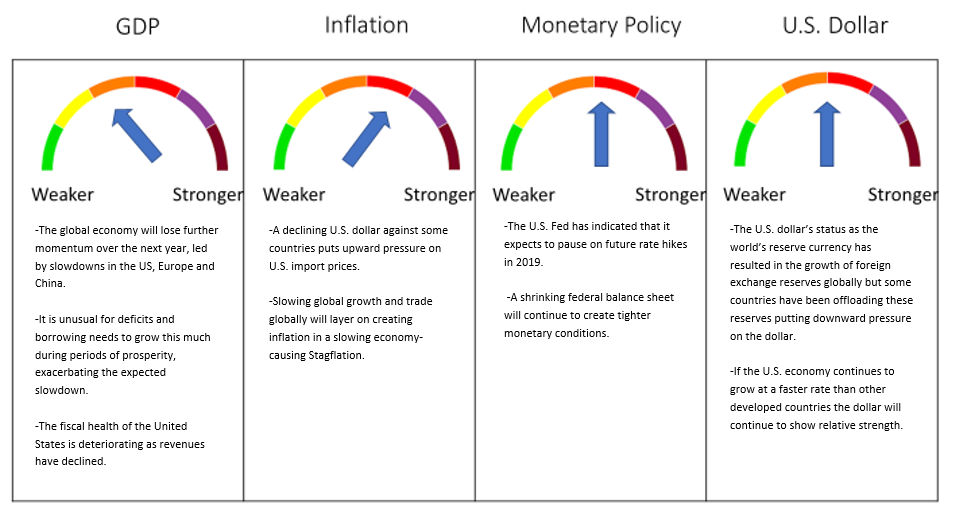
SOURCE: FRAME GLOBAL ASSET MANAGEMENT
Frame Global Asset Management considers these trends and factors them into our outlook for the economy in our twelve-month forward period. We look back to periods of similar economic behavior and use this information to predict the future behavior of the asset classes that we consider. Our investment process allows us to adapt for non-traditional monetary policy and other exogenous variables.
Section 4. March 2019 Portfolio Models
In March, we held our asset allocation constant at the February allocations. Allocation to Equities remains at 30% in Tactical Conservative, 40% in Tactical Moderate Growth, 50% in Tactical Growth, and 60% in Tactical Aggressive Growth, continuing the exposure to U.S. equities, with the balance in all models allocated to U.S. municipal bonds and mid-term U.S. treasuries. This asset allocation continues to reflect our concerns that the U.S. economy is slowing but is more stable than other global equity markets and the relative attractiveness of interest rates in the U.S. versus the rest of the world.
Geopolitical risks remain elevated with Brexit’s outcome uncertain, upcoming elections in the European Union, and the leadup to the U.S. 2020 presidential election campaign likely to impact economic growth and markets. In addition, the combined effects of sanctions on Iran’s and Venezuela’s oil sectors, Saudi Arabia’s need to push oil prices up in order to get its finances in order, and of the recent agreement by OPEC and other countries to cut production means that geopolitics could have an outsized impact on oil prices over the next several months.
Progress on U.S./China trade negotiations and the Federal Reserve’s more dovish rhetoric regarding further interest rate hikes have not convinced us to change our forward outlook that expects the U.S. economy to experience stagnation over the next twelve months.
Deborah Frame, CFA, MBA
President and Chief Investment Officer
April 14, 2019
iVolatility is a statistical measure of dispersion of returns for a security. Volatility is measured using the standard deviation or variance of returns of that security. A higher volatility means that the security’s value covers a larger range. Correlation is a statistical measure that indicates the extent to which two or more variables fluctuate together. A positive correlation indicates the extent to which those variables increase or decrease in parallel; a negative correlation indicates the extent to which two or more variables more in opposite directions.
iiS&P Dow Jones U.S. Dashboard, March 2019.
iiiThe Beige Book. Summary of Commentary on Current Economic Conditions, By Federal Reserve District. March 6, 2019.
ivOn March 8, 2018, U.S. President Donald Trump signed two proclamations placing tariffs on imports of steel and aluminum. The tariffs are authorized under Section 232 of the Trade Expansion Act of 1962 on the grounds of national security.
vWorld Trade Organization. Global trade growth loses momentum as trade tensions persist. Press/837. April 2nd, 2019.
viCapital Economics. The Chief Economists Note. Taking stock of the health of the global economy. March 18, 2019.
viiMcKinsey & Company. China Brief: The state of the economy. March 2019.
viiiMcKinsey & Company. China Brief: The state of the economy. March 2019.
ixMcKinsey & Company. China Brief: The state of the economy. March 2019.
xJ.P. Morgan. Global Data Watch. Economic Research. March 22, 2019.
xiAmadio, Kimberley. The Balance. Inverted Yield Curve and Why It Predicts a Recession. March 26, 2019.
xiiFederal Reserve Board. Federal Reserve Issues FOMC Statement. Press Release. March 20, 2019.
xiiiFederal Reserve Board. Quarterly Report on Federal Reserve Balance Sheet Developments. March 23, 2019.
xivBloomberg.
xvReade, John. World Gold Council. Gold Investor, February 2019. February 12, 2019.
xviAmundi. Investment Insights Blue Paper. Gold in central banks’ asset allocation. March 2019.
xviiGopaul, Krishan. World Gold Council. Goldhub blog. Strong start for central bank demand in 2019. April 8, 2019.
xviiiBloomberg.
xixAmundi. Investment Insights Blue Paper. Gold in central banks’ asset allocation. March 2019.
xxJ.P. Morgan. Cross-Asset Strategy. The J.P. Morgan View. April 5, 2019.
xxiJ.P. Morgan. Cross-Asset Strategy. The J.P. Morgan View. April 5, 2019.