
Section 1. Q4 2018 Outlook
Economies Diverge and Divisive Politics Dominate
A year ago, global economies were enjoying synchronized growth.
Growth increased in every large economy during 2017, except Britain, and even in most emerging economies. Global trade was surging with the U.S. booming and China’s deflation under control. While President Trump’s tax cuts helped lift annualized quarterly growth above 4% and unemployment is its lowest since 1969, the IMF is predicting growth will slow in 2018 in every other large advanced economy and in emerging markets that are under stress1 . Emerging markets account for 59% of the world’s output (measured by purchasing power), up from 43% two decades ago, when the Asian financial crisis hit2 . Global trade disruptions impact global growth along with capital balances and flows globally.
Along with the deviation in GDP between the U.S. and the rest of the world is monetary policies. While the Federal Reserve has raised interest rates eight times since December 2015, the European Central Bank (ECB) is still a long way from its first increase. In Japan rates are negative. China has relaxed monetary policy in response to a weakening economy. When interest rates rise only in the United States, the dollar strengthens, making it harder for emerging markets to repay their dollar debts. The rising dollar has already propelled Argentina and Turkey into trouble and Pakistan has asked the IMF for a bail-out.
We see many additional divergences including between productivity and real wages, in the inequality between and within countries and across skill and income segments of labour markets around the globe. In the first three industrial revolutions, capital was applied to innovation, complementing labour to permanently shift how the economy worked. As global economies experience shifts in employment, diverging productivity and real wages, intergenerational inequality and politically charged tensions are growing between automation and those whose livelihoods it threatens. The current regime shift is unlike the previous three industrial revolutions in that technological capital is being applied as a substitute for labour rather than as a complement to labour.
We look at the way that the economy is evolving in order to better understand where it is heading. A cover story published in The Economist on April 30th, 2016, “The Prosperity Puzzle,” documented several reasons why official measurements of U.S. inflation, GDP, and productivity growth fail to measure economic activity in the modern economy and have become misleading. We discussed this shift in the relationship among economic measures in our Q2 2016 Quarterly Summary and Outlook, available on our website. The article discussed that the link between productivity growth and modern living standards has changed. At the root of this issue is that productivity growth measures the increase in output per worker hour in a world where the meaning of “output” has become less obvious, as some of this “output” is not relatable to conventional living standard measurements. The greater use of capital directed toward technology and artificial intelligence in areas previously dominated by labour is at the center of this shift. Globalization, liberalization of labour markets, migration and inflation targeting are affecting growth and inflation, investment, wages, productivity and employment.
We recognize that while the global economy is integrated due to trade and the flow of capital and currency, actions taken within one economy can isolate it from the rest of the world. This is a feature of our adaptive tactical investment process. In the U.S, the dominant narrative for Donald Trump’s ascent to the White House has been that his “America first” message appeals directly to those who feel that they are being “left behind.” Actions taken regarding trade and fiscal policy have important implications for economic growth and interest rates both within the United States and abroad.
To reiterate our investment approach, we consider the outlook for the global economy relative to a view of expected U.S. GDP growth in the twelve months ahead. The outlook falls into one of our five broad descriptions: GROWTH, STAGNATION, RECESSION, INFLATION and CHAOS, allowing for a transitioning in the period from one environment to another as well as recognizing total regime shifts (see White Paper 2 available on our website). Entering the fourth quarter of 2018, our outlook has evolved to a six-month period of U.S. Growth followed by six months of inflation.
Dollar Strength is Both Inevitable and Self Defeating
The dominance of the US dollar, being the primary reserve currency and the currency that commodities are priced in, makes the existence of a U.S. trade deficit almost inevitable. The constant demand for US dollars outside of the United States reinforces the currency’s value and the stronger it is relative to other currencies, the more it makes U.S. imports of overseas goods cheaper in US dollar terms and the less competitive it makes U.S. exports.
Two years ago in our Q1 2016 Report, available on our website, we were addressing a very different situation as the US dollar had declined against other major currencies since its peak at the beginning of the year. Three key developments had explained the slide; higher commodity prices, increased appetite for safe havens and a scaling back of expectations for tighter Fed policy. Emerging market currencies had seen improvement as commodity prices had recovered. The Chinese renminbi had strengthened against the US dollar, having been one of the best performing currencies. This had an adverse impact on China’s manufacturing sector and particularly exporters.
Now the situation is the opposite, as the US dollar has strengthened for the reasons cited. When the U.S. economy is at full employment, trade sanctions against imports add fuel to domestic inflation, prompting the fed to raise rates further, causing the dollar to strengthen further, resulting in cheaper imports and more costly exports. In this environment, further Fed rate hikes have less impact on wage inflation due to full employment and only worsen the incentive to buy cheaper imported goods.
At this stage in the economic cycle, a U.S. recession could quickly impact the global economy. Our concern is that the developed world is not prepared to deal with even a mild recession. The policy arsenal remains depleted from fighting the last downturn. In the past half-century, the Fed has typically cut interest rates by five or so percentage points in a downturn. Today it has less than half that room before it reaches zero while the euro zone and Japan have no room at all.
Canada Weathers Trade Attacks from the U.S.
In Canada, the economy continues to show strength while well-contained inflation numbers support that the Canadian economy remains on the growth path. Exports were the main driver of the boost in annualized GDP growth from 1.4% in Q1 to 2.9% in Q23 . Household spending growth rebounded, although remaining lower than in 2017. Annual non-energy export growth hit a 2-year high of 4.3% in August, confirming that exporters are benefitting from stronger global demand and accelerated U.S. growth4 . Exporters should receive a further boost following the successful conclusion of trade talks with the U.S., which would also encourage more business investment. This was reflected in the Bank of Canada’s third-quarter Business Outlook Survey which revealed a strong rebound in firms’ investment intentions.
Going forward we continue to monitor the direction of commodity prices, the demand for safe havens and the federal funds rate as well as employment, consumer spending, business sentiment, the yield curve, inflation, and global economics. Our focus is on protecting portfolios from downside risk, and we believe that our investment process is working to achieve that goal.
Section 2. Four Themes
Theme 1: United States Approaching the Tipping Point
U.S. Real GDP increased at an annual rate of 4.2% in Q2 2018, according to the “third” estimate released by the Bureau of Economic Analysis. In Q1, real GDP increased 2.2%. For the third quarter, the 0.5% month-over-month rise in underlying retail sales in September suggests that real consumption growth was 3.5% annualized but net trade, driven by Trump’s trade wars appears to have been a drag on GDP growth5 . Current consensus for GDP growth in the third quarter is 3%, a solid number despite the decline from the second quarter. Real 2-year Treasury yields have now risen by over 200 bp since reversing, matching the increases ahead of each of the past three recessions.
There are signs that rising borrowing costs are weighing on rate-sensitive sectors of the economy, with the drop back in housing starts in September confirming that residential investment was once again a drag on the economy in the third quarter. Not only are homebuilders struggling with severe labour shortages, but the surge in mortgage interest rates this year is clearly taking its toll on demand. Consumption has been amplified by tax cuts but rising interest rates are starting to constrain auto purchases as well as housing market activity. At the same time, the economy is closing in on full employment and barriers to expansion including labor shortages are evident in several industries.
The boost from fiscal stimulus resulting from the tax cuts is close to fully absorbed and as economic growth begins to slow due to a textbook monetary policy tightening cycle, the Fed will be prompted to stop raising interest rates. We anticipate this to happen midway through 2019 with the risk that the tightening that will have occurred up to that point may have already put the economy into a recession.
About that Deficit
The U.S. budget deficit expanded to an estimated $782 billion in the first fiscal year of the Trump presidency, which is the widest fiscal gap since 2012 when the country was emerging from the Great Recession6 . The current deficit is equal to an estimated 3.9% of gross domestic product, up from 3.5% the prior year7 . Government revenues were about the same as the prior year while outlays grew about 3%, according to the Congressional Budget Office.

SOURCE: THOMSON REUTERS DATASTREAM, ALLIANCE BERNSTEIN GLOBAL
MACRO OUTLOOK OCTOBER 2018.
The budget deficit has continued to climb in recent years, raising concerns that the country’s debt load, over $21.5 trillion at the end of September, is growing out of control8 . In October, the Treasury reported that the government paid $523 billion in interest in fiscal year 2018, the highest on record9 .
Theme 2: Inflation Fears are Real
As stock markets tumbled across the globe in mid-October, investors worried, for the second time this year, about slowing growth and the effects of tighter U.S. monetary policy.
One of the fears in the aftermath of the Global Financial Crisis was that very low, or negative, interest rates and the poorly understood “printing of money” implied by Quantitative Easing (QE) would lead to runaway inflation. That didn’t happen. Rather, deflation became a greater threat and central banks’ extreme actions represented an attempt to minimize that risk. Conditions of excess supply meant that inflation remained subdued for much longer than expected. But as demand has recovered, inflation is now making a comeback although primarily on the wage front and so far to a lesser degree in the pricing of goods and services.
American workers have been coping with weak real wage growth for a long time. According to the July jobs report, published August 3, 2018, the economy added 224,000 jobs on average per month over the prior three months, an annualized rate of 2.7 million, up from a rate of 2.2 million added in 2017, before the December 2017 Republican tax cuts10 . This job growth is expected to reduce unemployment, despite the fact a growing population may add about 1.3 million people to the labor force by mid-2019 and a similar number of net new people who have been rejoining the labor force (about 200,000 a year) over the past five years.
Rising wage pressure will eventually cause problems for Wall Street and the Fed. Wall Street would like to see the historically high profit margins that have recently provided support to valuations begin to compress, unless companies are able to pass on their cost increases to consumers. The Fed might have to choose between letting wages and inflation run a bit hot and risk rising inflation expectations or tightening monetary policy quicker and potentially causing a recession.
Theme 3: US and China: The End of Engagement
China’s economy has shown signs of slowing in recent months. Growth in the third quarter was at the weakest pace since the financial crisis in 2009. For the last six years, President Xi has been gradually allowing more foreign competition in some sectors while centralizing control over others. Though slowing, the Chinese economy is still growing at more than twice the pace of the United States and is pouring money into advanced technology such as artificial intelligence, quantum computing, and biotech.
The Trump administration imposed 25% tariffs on Chinese products beginning July 6, 2018. Almost all of the targeted products are intermediate inputs and capital equipment used by American companies to make final products and remain competitive in the global marketplace. The same products targeted by tariffs are available in other countries, such as Mexico, Japan, Canada, and Germany. U.S. companies are expected to evaluate product quality and prices across countries and decide whether it may be more advantageous to pay the Trump tariff and stick with the same Chinese product or buy a higher-quality input from an alternative source, impacting prices for consumers.
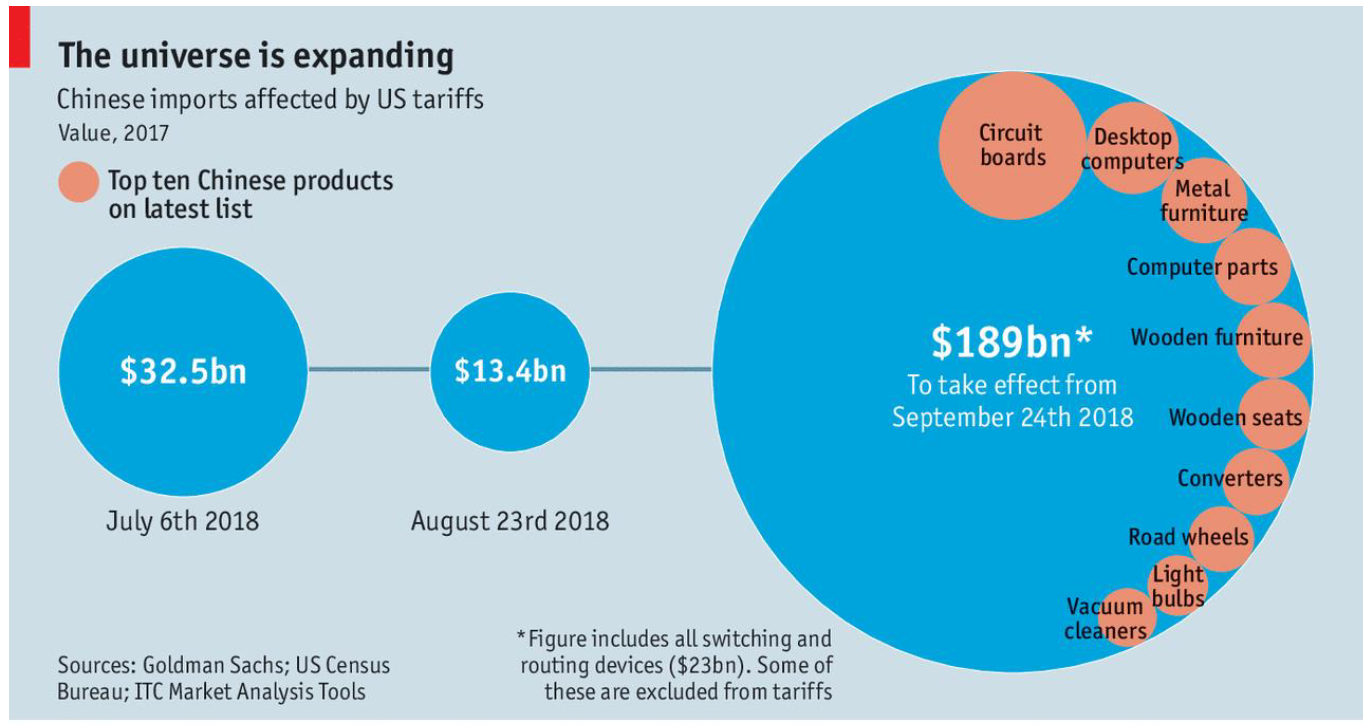
SOURCE: THE ECONOMIST. FINANCE AND ECONOMICS SEPTEMBER 20, 2018.
Time is most likely on the side of the Chinese. When China retaliated, announcing tariffs on up to $60 billion of American imports, it included a 25% tariff on soybeans to hurt farm states that had voted for Trump, such as Iowa11 . The fact that Iowa is both second among America’s soybean producers and disproportionately influential in American politics makes it a prime target. China wants a deal, but Trump believes he is leading a fight against globalism, by which he means any order that binds American sovereignty or fails to put American workers first.
China has a very significant stake in the stock of U.S. Treasuries. The U.S. depends on foreigners, who hold and refinance their treasury positions, to finance their growing budget deficit. China’s share of U.S. Treasuries fell for a third consecutive month in August, which may be viewed as a response to the trade war, especially after China’s ambassador to the U.S. signaled in March that his country could scale back purchases of debt as retaliation. Chinese ownership of U.S. bonds, bills, and notes was $1.165 trillion in August, down from $1.171 trillion in July, according to data released by the U.S. Treasury Department. China may well have allowed its foreign-exchange reserves to decline as part of a policy to stabilize the yuan and prevent it from weakening further. The currency already has depreciated more than 4% against the dollar in the past year amid signs of an economic slowdown and capital outflows. While this has occurred, it is also noteworthy that Japan, which is the largest foreign owner after China, decreased its Treasury holdings in August to $1.03 trillion from $1.036 trillion in July while Saudi Arabia increased its ownership by $2.7 billion to a record $169.5 billion12 .
The U.S. and China are more commercially linked than the U.S. and the Soviet Union. They share responsibilities including the environment and security interests, such as the Korean peninsula. When the U.S. competes with China as a guardian of a rules-based order, it starts from a position of strength, however, when the U.S. becomes a weaker moral and political force, it loses its primary advantage. Recognizing this from a U.S. negotiating perspective would aid the U.S. in trade gains with China.
Theme 4: The End of the Low Volatility Era
Equity volatility rose across the board during October, led by a sell-off in large U.S. technology and communications names, and possibly reinforced by signs of rising long-dated Treasury yields.
It is more common for economic downturns preceded by market volatility to be caused by multiple factors rather than a single one. Over the last 45 recessions, monetary policy tightening contributed to 29 of them. Other contributing factors include the bursting of credit bubbles, oil shocks, property collapses, tight fiscal policy, exchange rate shock, and external demand shock.
Factors Contributing to 45 Recessions in G7 Economies Since 1960
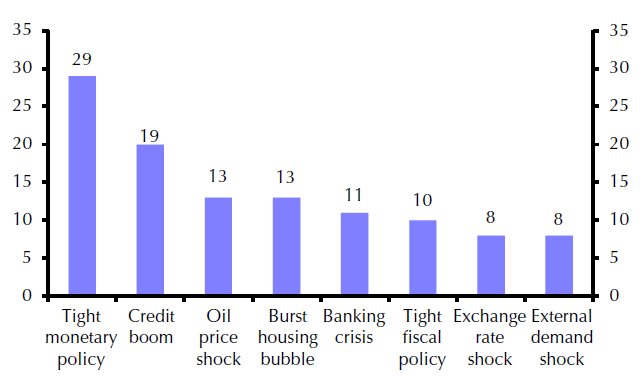
SOURCE: CAPITAL ECONOMICS. GLOBAL ECONOMICS FOCUS. OCTOBER 26, 2018.
The United States is further along in its economic cycle than other global economies and the appropriate level of tightening in policy rates will also continue to have a variety of knock-on effects to other economies across the world. We saw this happen in certain Emerging Markets countries this year, such as Argentina and Turkey, which have experienced extreme levels volatility in currency and rates. These pressures will likely underpin asset volatility in these markets, while trade war risks can potentially keep volatility elevated in some regions.
During higher volatility, correlations have remained relatively low as defensive sectors and dividend-payers bucked the trends. With earnings season getting into full swing, lower correlations will likely continue as U.S. companies continue to benefit from the tax cuts earlier in the year. Volatility indicators increased globally along with the VIX, although none rose quite as much as the United States.
Section 3. Investment Outlook
U.S. Growth in the first half of the year leading to Inflation in back half of the year
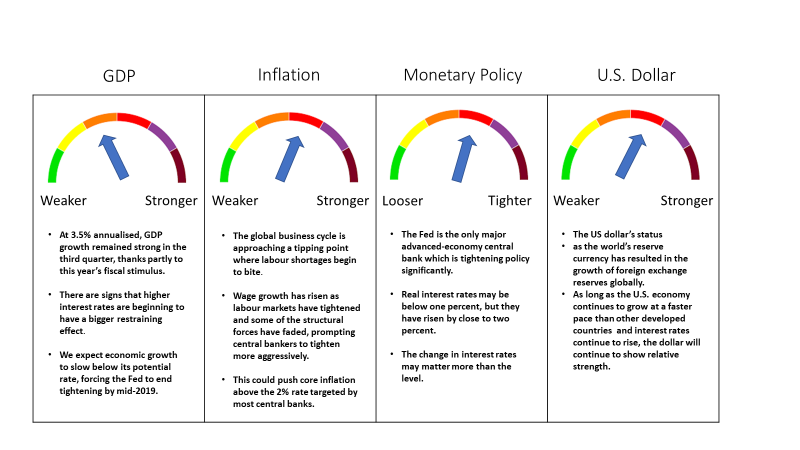
SOURCE: FRAME GLOBAL ASSET MANAGEMENT
Frame Global Asset Management considers these trends and factors them into our outlook for the economy in our twelve-month forward period. We look back to periods of similar economic behavior and use this information to predict the future behavior of the asset classes that we consider. Our investment process allows us to adapt for non-traditional monetary policy and other exogenous variables.
Section 4. September 2018 Portfolio Models
In September, we increased our exposure to U.S. Equities across all models at 40%, 50%, 60% and 70% in the Tactical Conservative, Moderate Growth, Growth and Aggressive Growth respectively.
This is consistent with our recognition that the tax cuts from earlier in the year are having a short-term positive impact on the economy that is more than offsetting the uncertainty created by the trade wars initiated by the U.S. on China as well as many other trading partners including Canada and Mexico.
We added this net new exposure to Large Cap U.S. Equities with additional exposure coming from U.S. Small Cap.
Deborah Frame, CFA, MBA
President and Chief Investment Officer
October 14, 2018
1The Economist. The Next Recession. October 11, 2018.
2The Economist. The Next Recession. October 11, 2018.
3Capital Economics. Global Economic Outlook. Q4 2018.
4Capital Economics. Global Economic Outlook. Q4 2018.
5Capital Economics. United States Chart Book. October 18, 2018.
6Congressional Budget Office, October 5th, 2018.
7Congressional Budget Office, October 5th, 2018.
8TreasuryDirect.gov. Public Debt Reports. Debt to the Penny.
9TreasuryDirect.gov. Interest Reports. Interest Expense on Debt Outstanding.
10Bls.gov. The Employment Situation – July 2018. August 3, 2018.
11The Economist. America and China are in a proper trade war. September 20, 2018.
12Treasury.gov. Major Foreign Holders of Treasury Securities.