Economic activity has accelerated and is expected to remain strong into the third quarter of 2021, largely due to vaccination progress, economic re-opening, and large-scale fiscal stimulus. The U.S. is expected to be the principal driver of growth, followed closely by Europe as April restrictions are eased.

While the demand side of the global economy is heating up, the global growth boom underway is creating bottleneck pressures. Factory output has struggled to keep up with demand due to pandemic-related restrictions and shortages of intermediate inputs. Much of the year-over-year price increase can be attributed to base effects, coming off the low point for demand that occurred one year ago. The remainder of this recent inflation push is due to temporary factors such as stimulus-driven demand and supply chain restraints. The Fed and other developed global central banks have indicated that easing has reached a peak. Taper has started at the Bank of Canada and the Bank of England. As we monitor the recovery, we are aware that the global labor market is slow to heal, with the U.S. still 10 million jobs short of pre-pandemic levels.1 We have maintained our economic outlook of three months of Growth followed by Stagnation for the remainder of our twelve-month forecast horizon.

The Chinese economy advanced 18.3% year-on-year in the first quarter of 2021, boosted by strengthening domestic and global demand, strict virus containment measures, and continued fiscal and monetary support, and accelerating sharply from a 6.5% growth rate in the fourth quarter.2 China’s surveyed urban unemployment rate eased to 5.1% in April, compared to 5.3% in March and 6.0% in the same period last year.3

The Euro Area economy shrank 0.6% in the January-March quarter entering a double-dip recession, as several countries across the region imposed social distancing and lockdown measures to curb the spread of the coronavirus pandemic. Among the bloc’s largest economies, Germany, Italy, Spain, and the Netherlands fell back into contraction territory, while France’s economy returned to growth as the government delayed the imposition of lockdown.4

The U.S. economy grew by an annualized 6.4% in the first quarter, following a 4.3% expansion in the previous three-month period.5 With Janet Yellen and Jay Powell heading up macroeconomic and central bank policymaking, and with U.S. rates at the lower bound and the Fed having adopted Average Inflation Targeting, 2021 is likely to bring previously unseen coordination between the fiscal arm of the federal government and the central bank. Increases in personal consumption expenditures (PCE), non-residential fixed investment, federal government spending, residential fixed investment, and state and local government spending were partly offset by decreases in private inventory investment and exports.6 U.S. core consumer prices rose 3.0% in April 2021, the largest annual increase since January 1996.7

The U.S. Labor Department released soft jobs data for April 2021 showing an increase of 266,000, versus estimates for a 1 million gain.8 Canada’s job recovery hit a snag in April as a third wave of lockdowns across most provinces, including Ontario, led to fresh employment losses. The country shed 207,100 jobs in April, partially erasing large gains over the previous two months. The unemployment rate rose to 8.1% in April, from 7.5% a month earlier. Canada’s economy remains about half a million jobs shy of pre-pandemic levels.9

U.S. equities ended April on a positive note, with the S&P 500 posting a gain of 5.3%. Smaller caps also posted gains, with the S&P MidCap 400 and the S&P SmallCap 600 up 4.5% and 2.0%, respectively. U.S. fixed income performance was positive across the board. Canadian equities posted gains in April, with the S&P/TSX Composite up 2.4%. The S&P Europe 350 rose 2.2%, lifting its year-to-date return to 11.0%. The S&P United Kingdom outperformed, rising 4.0%, however the bulk of the European benchmark’s return was due to France, while Italy was a notable exception. Asian equities posted gains in April, with the S&P Pan Asia BMI up 1.8%. Most Asian single-country indices posted gains. Gold’s ability to protect against more than increases in the general price level suggests that its long-term real returns should be positive.

Equity exposure across all models reflects our view that markets are looking through the uncertainty of the pandemic and towards the resumption of more normal life once populations are vaccinated. In May, we maintained the asset allocation that we established in April. Fiscal spending that funds local governments supports our exposure to treasuries and municipal bond exposure in the U.S. We continue to include exposure to gold as a portfolio stabilizer.

The economic reopening and the global stimulus that is underway will lead to improved household liquidity, healthy consumer balance sheets, and a healing labor market. Our approach to portfolio management is nimble, opportunistic, and deliberate in identifying asset classes that are best placed to generate returns in a new world order. Our focus is on protecting portfolios from downside risk, and we believe that our investment process is working to achieve that goal.


Deborah Frame, President and CIO


1 U.S. Bureau of Labor Statistics. May 7, 2021.

2 Trading Economics. China GDP. April 16, 2021.

3 Trading Economics. China Unemployment National Bureau of Economics. May 11, 2021.

4 Trading Economics. Europe GDP. May 18, 2021.

5 Trading Economics. U.S. GDP. April 29, 2021.

6 Trading Economics. U.S. Inflation, U.S. Bureau of Economics. May 12, 2021.

7 Trading Economics. U.S. Inflation, U.S. Bureau of Labor Statistics. May 12, 2021.

8 Trading Economics. U.S. Employment, U.S. Bureau of Labor Statistics. May 7, 2021.

9 Trading Economics. Canadian Employment, Statistics Canada. May 7, 2021.


Index return data from Bloomberg and S&P Dow Jones Indices Index Dashboard: U.S., Canada, Europe, Asia, Fixed Income. April 30, 2021. Index performance is based on total returns and expressed in the local currency of the index.


The tug-of-war between the virus and the global immunization effort intensified in March. The focus now will be on economic reopening. Every recession is different and the events that led to the great recession of 2020 were unique, as has been the response from governments and central banks. Through large-scale fiscal transfers and central bank actions in many economies, households and businesses have been supported through the crisis and are in a position to emerge with their balance sheets largely intact. Our twelve-month forward outlook remains three months of Growth, followed by nine months of Stagnation, as we have seen evidence of a stronger short-term recovery rebound but a lingering longer-term impact on employment and output.

Emerging Market Asia is being buffeted by a number of forces including the policy-induced downshift in China and the sustained pandemic drag. The Chinese economy advanced 18.3% year-on-year in the first quarter of 2021, accelerating sharply from a 6.5% growth in the fourth quarter of 2020.1 Exports from China soared 30.6% year-on-year to USD 241.1 billion in March 2021, slowing from a record 154.9% growth in February. Among major trade partners, exports were up to the U.S. (53.3%), the EU (45.9%), and Australia (23.1%).2

The Eurozone economy shrank by 0.7% in the fourth quarter of 2020, following a record 12.5% expansion in the previous three-month period. Among the bloc’s largest economies, France, Italy, and the Netherlands contracted in the fourth quarter, while GDP growth in Germany and Spain slowed sharply.3 For the year 2020 as a whole, GDP fell by 6.6%.4 The U.K. remains among the global leaders in vaccine distribution with nearly half of its population having received at least one dose and daily vaccinations reaching 0.8 per 100 population in late March. The consumer price inflation rate in the Euro Area was confirmed at 1.3% year-on-year in March 2021, the highest since January 2020.5

The U.S. is vaccinating its population and reopening its economy, while the fiscal response has also been more expansionary. The American Rescue Plan of $350 billion will be followed with higher tax rates, shifting interest towards more favorable asset classes including tax exempt municipal bonds. The U.S. economy expanded an annualized 4.3% in Q4 2020 but shrank 3.5% for the year.6 The U.S. dollar advanced and capped its first quarterly gain in a year, thanks to the U.S. growth dynamic versus its global peers. The Canadian economy expanded 2.3% in the last three months of 2020, following a record 8.9% growth in the previous period.7 Canada’s trade surplus narrowed to CAD1.04 billion in February of 2021 from a revised CAD1.21 billion in the previous month. Total exports decreased by 2.7% to CAD49.9 billion in February, a level 4.1% higher than that set in February 2020.8 On balance sheet policy, the Bank of Canada began its tapering at the end of April.

U.S. equities ended the first quarter of 2021 on a strong note, with the S&P 500 posting a gain of 6.2%. Smaller Caps outperformed, with the S&P Mid Cap 400 and the S&P SmallCap 600 up 13.5% and 18.2% for the quarter, respectively. Canadian equities posted strong gains in Q1, with the S&P/TSX up 8.1%. International performance was also positive. The S&P Europe 350 closed the first quarter of 2021 up 8.7%. The United Kingdom was responsible for 2.5% of the total while France was the second-largest contributor with 1.5%. Asian equities had a positive start to the year, with the S&P Pan Asia BMI up 2.7% in the first quarter. Early-2021 trends of rising government bond yields and strong equity markets continued in March, reflecting the brighter economic outlook and increased fiscal support, particularly in the U.S. In March, the MSCI All Country World Index gained 2.5%, led by the S&P 500 (4.2%) and the S&P/TSX (3.6%). International stocks also had a modest (1.8%) gain. By contrast, the MSCI emerging market benchmark shed 1.7%.

Equity exposure across all models reflects our view that markets are looking through the uncertainty of the pandemic and towards the resumption of more normal life once populations are vaccinated. In April, we maintained the asset allocation that we established in March. Fiscal spending that funds local governments supports our exposure to U.S. treasuries and municipal bond exposure in the U.S. We continue to include some exposure to gold as a portfolio stabilizer.

The economic reopening and the global stimulus that is underway will lead to improved household liquidity, a wealth effect from rising asset values and lower consumption, healthy consumer balance sheets, and a healing labor market. Our approach to portfolio management is nimble, opportunistic, and deliberate in identifying asset classes that are best placed to generate returns in a new world order. Our focus is on protecting portfolios from downside risk, and we believe that our investment process is working to achieve that goal.


Deborah Frame, President and CIO


1 Trading Economics. China GDP Growth. April 16, 2021.

2 Trading Economics. China Trade: General Administration of Customs. April 13, 2021.

3 Trading Economics. Eurozone GDP Growth. March 9, 2021.

4 Trading Economics. Eurozone GDP Growth: EUROSTAT. March 9, 2021.

5 Trading Economics. Eurozone Inflation. March 16, 2021.

6 Trading Economics. U.S. GDP Growth. March 25, 2021.

7 Trading Economics. Canada GDP Growth. March 2, 2021.

8 Trading Economics. Canada Trade. April 7, 2021.


Index return data from Bloomberg and S&P Dow Jones Indices Index Dashboard: U.S., Canada, Europe, Asia, Fixed Income. March 31, 2021. Index performance is based on total returns and expressed in the local currency of the index.


Section 1: Q2 2021 Outlook


Now Is an Opportune Time to Make an Allocation to Global Macro Strategies

Global Macro is an investment style that is highly opportunistic and has the potential to generate strong risk-adjusted returns in challenging markets. Against a backdrop of the current pandemic, uncertainty, and potentially increased volatility, we felt it would be timely to share our insights on the approach and explain why we believe now could be an opportune time to make an allocation to Global Macro Strategies.

The impact of the macro-economic environment is different among different asset classes and changes over time. Global Macro driven investment decisions are particularly important in high uncertainty/high volatility environments where macro factors exert a meaningful influence on asset pricing. These types of environments affect factors such as interest rate differentials, foreign exchange balances, and the consequent over and under valuation of asset classes and sectors, which may be exploited through nimble and tactical positioning.

Perhaps the most universally accepted concept of prudent investing is to diversify, yet this concept grossly oversimplifies the challenge of portfolio construction. The goal of diversified investment management is to earn the highest return while meeting the risk tolerance criteria of an investor through asset allocation and selection. Asset allocation models can be defined as Conservative, Moderate Growth, Growth, and Aggressive Growth or by Defensive, Defensive Balanced, Balanced, Balanced Growth, and Growth. Regardless of the labels, the risk profiles for these models are mandated to reflect the risk tolerance of the clients who invest in them.

When asset classes are combined in a portfolio, the amount and direction of each change over time will benefit or hurt the overall risk of the portfolio. Correlation is a statistic that measures the degree to which two variables move in relation to each other. In optimal portfolio allocation, if all stocks tend to fall together as the market falls, the value of diversification is lost. Negative correlations describe a relationship between factors that move in opposite directions. Negative correlations are of particular interest in the financial world since negatively correlated assets move in opposite directions. Asymmetric correlation occurs when correlations behave differently in negative environments than they do in positive ones. Correlations between asset classes, measured over the full sample of returns, have been found to demonstrate this behavior.


Diversification Disappears When it is Most Needed

Numerous studies that have examined correlation asymmetry support a finding of the undesirable variety: characterized by high positive correlations among asset classes in negative markets when low and negative correlations are needed, and low or negative correlations in upside markets when high and positive correlations are needed.i ii iii However, Global Macro strategies exhibit appealing downside correlations relative to equities, bonds, and other hedge fund strategies. This can be well understood given Global Macro’s lower exposure to systematic liquidity risk and systemic deleveraging risk.


Portfolio Construction: Manage Portfolio Correlations Rather Than Static Asset Allocation

SOURCE: PAGE, SÉBASTIEN AND PANARIELLO, ROBERT (2018). “WHEN DIVERSIFICATION FAILS.” FINANCIAL ANALYST JOURNAL. VOL. 74, NO. 3.


Asymmetries in upside and downside correlations have also been found to exist between stocks in a single market, as well as across markets internationally.iv The “neutral” asset allocation of 60% of a portfolio held in stocks and 40% in cash, bonds, and other financial assets that does not adjust will experience asymmetric correlations in negative markets, as will asset allocation ranges above and below 60/40. Asymmetric correlations also have similar implications in risk management when looking at the behavior of bonds.

Frame Global Asset Management uses a Global Macro approach. We consider the outlook for the global economy relative to a view of expected U.S. GDP growth in the twelve months ahead. The outlook falls into one of our five broad descriptions: GROWTH, STAGNATION, RECESSION, INFLATION and CHAOS, allowing for a transitioning in the period from one environment to another as well as recognizing total regime shifts. (See White Paper 2).v

We define Growth, Stagnation, Inflation, Recession and Chaos as the following:

Growth: U.S. Real GDP growth greater than 2.5%
Stagnation: U.S. Real GDP growth between 0 and 2.5%
Inflation: U.S. CPI greater than 3.5%
Recession: U.S. Real GDP less than 0%
Chaos: All asset classes exceed a correlation threshold

In doing this, we can recognize the changing correlations among asset classes and adjust when they change. The historical monthly return data of over forty asset classes is tagged using rules to assign each month with one of the five environments. From this tagging, expected return distributions are created by drawing from twenty years of return data using bootstrapping (random sampling with replacement) from past economic environments that are similar to what is anticipated in the coming twelve months. The twelve-month forward outlook and updating of expected return distributions is updated monthly.


We Measure What Matters: The Degree to Which a Given Asset Diversifies the Main Growth Engine When It Underperforms

Our own research shows that when historic data for asset classes is partitioned under these broad economic environments, patterns of behavior emerge. This allows us to create portfolios using ETFs that are the closest proxy to the asset classes that are used in the modelling process. Using ETFs, we can specifically address expected returns among the asset classes being considered while also addressing the probability of negative returns in those asset classes in the anticipated economic environment.

Global Macro investments tend to perform best in high uncertainty/high volatility environments where macro factors exert a meaningful influence on asset pricing. We believe today’s markets will remain in a state of disequilibrium over the next year, making current asset valuations increasingly fragile.

It is not enough to evolve a portfolio within equities or fixed income in environments where all equities or all bonds are highly and positively correlated or correlated with each other. In these environments, it is important to recognize the correlations and the lack of diversification benefit. In these negative return environments, it is important to have permission, within investment policy across the risk sensitivity spectrum of clients, to shift to low and negatively correlated asset classes. This involves the consideration of global equities as well as broad fixed income and market capitalization.

The current environment seems to be one in which Global Macro is well positioned for successful portfolio management.


Section 2: Four Themes


Theme 1: Greater Global Co-Operation

A meeting of central bankers and finance ministers from 19 of the world’s largest economies plus the European Union – the G20 – was held in early April to discuss issues facing the global economy.vi

• The G20 acknowledged the improved global economic outlook due to vaccination campaigns and continued policy supports, especially in advanced economies, while focusing on the uneven recovery across and within countries. It committed to protect those most impacted, including “women, youth, informal and low-skilled workers.”

• The G20 extended the Debt Service Suspension Initiative (DSSI) until end-2021, recognizing the unique challenges faced by low-income emerging markets (EMs). 46 countries have requested debt relief worth $12.5 billion. The new extension would cover an estimated $9.9 billion in bilateral debt payments.

• The G20 called on countries to “develop forward-looking strategies regarding climate change and environmental protection, investing in innovative technologies and promoting just transitions toward more sustainable economies.” Climate change took a backseat during the Trump era but is likely to retake center-stage in future post-pandemic meetings.

• The Group talked about reforming the WTO. This is important because the pandemic has accelerated protectionism, increased deglobalization pressures and made countries more inward-looking.

• The G20 also called for cooperation for a “globally fair, sustainable and modern international tax system.” A global minimum corporate tax would allow the U.S. to raise additional revenue from U.S.-based European companies and other multinationals.


Theme 2: Inflation Threat Brewing

We define an Inflationary environment as periods when the year-on-year realized CPI increases beyond 3.5%. Central banks globally generally target 2%. For decades, inflation has not been a problem in developed markets. Both monetary and fiscal policy have contributed to economic circumstances that are disinflationary, rather than inflationary, resulting in lower and less volatile inflation.

Today, inflationary regime change concerns point to four factors.

First, there has been an unprecedented increase in money creation. US M2 has grown by $4.2trn, from $15.5trn to $19.7trn in one year (to February 2021).vii

Second, there has been extraordinary fiscal accommodation that needs to be financed. The Congressional Budget Office (CBO) estimates a U.S. fiscal deficit of $3.1trn in 2020, or 15% of GDP. The CBO forecasts the deficit will shrink to $2.3trn in 2021, or 10% of GDP. In the entire modern history of the US, there have only been two instances of consecutive double-digit deficit years.viii

Third, the bond market is signaling increased inflation as long-term yields have recently increased.

Fourth, the inflation derivatives market is pricing in a 31% probability that the average inflation rate will exceed 3% over the next five years.ix High and volatile inflation creates uncertainty, thus harming the ability of companies to plan, invest, grow, and engage in longer-term contracts. Moreover, while firms with market power can increase their output prices to mitigate the impact of an inflation, many companies can only partially pass on the increased cost of raw materials, shrinking margins.

U.S. core inflation currently stands at 2.6%.x Due to the uncertain pace of recovery from the pandemic, we are not yet forecasting an inflation environment in the next twelve months.


Theme 3: Higher Interest Rates and a Stronger Dollar Have Weighed On Gold

Gold is considered to be an effective hedge against inflation, but this has not happened in 2021. Following price weakness in the first two months of the year, the gold price extended its decline in March. Gold finished March at US$1,691.1/oz., down over 10% y-t-d, its weakest quarterly performance since Q4 2016, and 18% below the record US$2,067/oz achieved in early August 2020.xi Gold’s performance has been weak across major currencies.

Recent analysis suggests gold’s current performance is consistent with the onset of previous reflationary periods. Analysis indicates that the primary driver of gold’s decline during March, and throughout Q1, was higher interest rates, impacting the opportunity cost of holding gold. While expectations of higher inflation kept building, the continued bond sell-off pushed nominal and real yields on sovereign debt higher during the month – with the 10- year Treasury yield seeing its sharpest rise in thirty years. Gold’s increased sensitivity to interest rates is a headwind in the short term, but the recent increase in interest rates is expected to level off as central banks continue to use monetary policy tools to keep them in check. Some central banks, including the Reserve Bank of Australia and European Central Bank (ECB), have increased bond purchases when local yields increased, while both the Federal Reserve and the Bank of England have signaled a continuation of their current asset-purchasing plans and level of target rates.xii

Despite the intense focus on rising yields during the quarter, the overall level of yields is structurally low. As a result, investors continue to shift their asset allocations from traditional high quality, low yielding bonds to assets which offer higher potential returns, but simultaneously have higher volatility.

Investors will eventually face elevated levels of risk (a driver of gold investment demand) in the short to medium term as markets continue to assess how monetary and fiscal strategies play out. The differing approaches to control higher yields taken by central banks around the world are likely to contribute to heightened risk as well. For example, the rising yield gap between the U.S. and Europe could put further pressure on the ECB and the stuttering economic recovery in the latter.

The reflation trade will also lead to the uneven performance of equities. Recent stimulus measures have flooded capital markets with liquidity, pushing financial asset valuations ever higher. Historically, gold has also underperformed commodities in the early stage of a reflationary period but tended to catch up and outperform in the longer term.

As investors look to guard against these risks, we expect gold will find further support in its role as a portfolio hedge.


Theme 4: U.S. Market Cap Rotation

The announcement of a vaccine for COVID-19 and the implementation of a series of fiscal and monetary stimulus plans to support a recovery in the U.S. economy has resulted in the more domestically focused small- and mid-cap segments of the U.S. equity market outperforming large caps. While this has occurred, the ownership of this space is largely domestic.

Mid- and small-cap U.S. equities represent a significant piece of the global market. The S&P Mid Cap 400 and S&P Small Cap 600 are benchmarks for U.S. mid and small caps. Over the past 20 years, they have outperformed the S&P 500, as well as a majority of actively managed U.S. equity funds in their respective size segment.xiii

The size and liquidity of mid- and small-cap U.S. equities are substantial in the context of global comparisons. At the end of 2020, the S&P Mid Cap 400 had a market capitalization similar to the entire French stock market, while the U.K.’s stock market, the largest in Europe, was roughly the same size as the mid- and small-cap indices combined.xiv

The prior outperformance of mega caps means that now, smaller companies have the potential to act as important diversifiers. The largest U.S. company by market capitalization, Apple, has risen from a 3% weight in the S&P 500 (as of December 2015) to a 6% weight at the end of Q1 2021, larger than the combined weight of 158 smaller constituents. Added to other “Big Tech” titans of Microsoft, Amazon, Alphabet, Facebook, and Tesla, just six companies compose 22.2% of the index, outweighing the 350 smallest names in aggregate.xv

We expect to see relative outperformance in the mid and small market cap sectors as we recover from the pandemic impacted market.


Section 3. Investment Outlook


Global Pandemic Leads Us to a Growth Forecast for the Next Three Months Followed by Nine Months of Stagnation

SOURCE: FRAME GLOBAL ASSET MANAGEMENT


Frame Global Asset Management considers these trends and factors them into our outlook for the economy in our twelve-month forward period. We look back to periods of similar economic behavior and use this information to predict the future behavior of the asset classes that we consider. Our investment process allows us to adapt for non-traditional monetary policy and other exogenous variables.


Section 4. March 2021 Portfolio Models

The macroeconomic outlook continues to improve, and the recovery may be faster than one that typically follows a business cycle recession, as vaccination rollouts accelerate, and the US$1.9 trillion stimulus package has been signed into law. This has prompted a surge in inflation expectations and commodity prices and a bond sell-off.

At this point in the recovery, households have used lockdown savings to pay down debt – particularly credit cards – while holding onto cash for precautionary reasons, causing demand to be suppressed. Our twelve-month forward outlook remains at three months of Growth, followed by nine months of Stagnation, as we have seen evidence of a stronger short-term recovery rebound but a lingering longer-term impact on employment and output.

Equity exposure across all models reflects our view that markets are looking through the uncertainty of the pandemic and towards the resumption of more normal life once populations are vaccinated. In March, we maintained the asset allocation that we established in February. We continue to include some exposure to gold as a stabilizer in this volatile environment. Shorter duration fixed income has been maintained as the U.S. economy normalizes and inflationary pressures are rising.

The economic reopening and the global stimulus that is underway will lead to improved household liquidity, a wealth effect from rising asset values and lower consumption, healthy consumer balance sheets, and a healing labor market.


Deborah Frame, CFA, MBA

President and Chief Investment Officer

April 14, 2021


iThe Myth of Diversification Reconsidered. MIT Sloan School Working Paper 6257-21. William Kinlaw, Mark Kritzman, Sebastien Page, David Turkington. February 2021.
iiThe Myth of Diversification. The Journal of Portfolio Management. David B. Chua, Mark Kritzman, and Sébastien Page. Fall 2009.
iiiAsymmetric Correlations of Equity Portfolios. Andrew Ang, Columbia University and NBER Joseph Chen, Stanford University. March 2002.
ivThe Myth of Diversification Reconsidered. MIT Sloan School Working Paper 6257-21. William Kinlaw, Mark Kritzman, Sebastien Page, David Turkington. February 2021.
vFrame Global Asset Management. White Paper 2. January 2016.
viG20 Communications. FSB. April 7, 2021.
viiTrading Economics. U.S. M2 Money Supply. February 2021.
viiiThe Best Strategies for Inflationary Times. Henry Neville, Teun Draaisma, Ben Funnell, Campbell R. Harvey, and Otto Van Hemert. April 4, 2021.
ixThe Best Strategies for Inflationary Times. Henry Neville, Teun Draaisma, Ben Funnell, Campbell R. Harvey, and Otto Van Hemert. April 4, 2021.
xTrading Economics. U.S. CPI. March 2021.
xiWorld Gold Council. Gold Market Commentary. April 2021.
xiiWorld Gold Council. Gold Market Commentary. April 2021.
xiiiS&P Dow Jones. Hidden in Plain Sight. Tim Edwards, Sherifa Issifu. April 2021.
xivS&P Dow Jones. Hidden in Plain Sight. Tim Edwards, Sherifa Issifu. April 2021.
xvS&P Dow Jones. Hidden in Plain Sight. Tim Edwards, Sherifa Issifu. April 2021.

The macroeconomic outlook continues to improve, and the recovery may be faster than one that typically follows a business cycle recession, as vaccination rollouts accelerate, and the US$1.9 trillion stimulus package has been signed into law. This has prompted a surge in inflation expectations and commodity prices and a bond sell-off. The latest round of global manufacturing PMIs have flagged rising input costs, growing order back-logs, and longer supplier delivery times. Commodity prices have increased sharply as seen in Bloomberg’s commodity price index, up 17.5% from December 1st to March 1st.1 Oil prices hit their highest level in more than a year in February with WTI crossing the US$60 per barrel mark.2 Higher shipping costs and input shortages will test central banks’ commitments to keep interest rates low for an extended period as pent-up demand could outpace supply. At this point in the recovery, households have used lockdown savings to pay down debt – particularly credit cards – while holding onto cash for precautionary reasons, causing demand to be suppressed.

Our twelve-month forward outlook remains at three months of Growth, followed by nine months of Stagnation, as we have seen evidence of a stronger short-term recovery rebound but a lingering longer-term impact on employment and output.

In China, an updated analysis shows that non-financial debt as a percent of GDP jumped 23% to 281% in 2020.3 The debt spike is likely to be temporary. China’s economy returned to its pre-pandemic growth path in the fourth quarter of 2020, which triggered an earlier-than-expected normalization in credit policy. In the Asia Pacific region, Australia’s economy grew at a stronger-than-expected pace toward the end of last year with a 3.1% non-annualized gain.4

The Euro Area has been hampered by lockdowns. The continent has been slow to ramp up vaccinations, with only slightly more than 5% of the population in major European countries having received at least one dose.5 The annual core inflation rate in the Euro Area, which excludes volatile prices of energy, food, and alcohol & tobacco, and at which the ECB looks in its policy decisions, slowed to 1.1% in February, from 1.4% in January.6 The U.K. is seeing a sluggish start to the year thanks to extended lockdowns and as the Brexit deal hit trade hard in January. A relatively speedy vaccine rollout that has seen 30% of the U.K. population receive at least one dose as of early March, should help the recovery beyond the current quarter.

The US$1.9 trillion stimulus package will add significantly to households’ purchasing power. Retail sales in the U.S. shrank 3% month-over-month in February of 2021, following an upwardly revised 7.6% jump in January.7 Housing starts reached the highest rate in 14 years in December as people moved away from the big cities due to the coronavirus pandemic but sank by 10.3% month-over-month in February.8 Prices for U.S. exports rose 1.6% from a month earlier in February 2021 while import prices increased 1.3% month-over-month.9 Canada’s fourth quarter GDP rose to an annualized 9.6%. The annual inflation rate remains low at 1.1% in February. Excluding gasoline, inflation was 1.0%, down from 1.3% in January.10

Despite a sell-off in the last week of the month, U.S. equities ended February on a positive note, with the S&P 500 posting a gain of 2.8%. Smaller caps outperformed, with the S&P Mid Cap 400 and the S&P Small Cap 600 up 6.8% and 7.7%, respectively. Volatility remained high, with the VIX closing the month at 27.95. U.S. Treasury performance was negative. Canadian equities ended February strongly, with the S&P/TSX Composite up 4.4%. Despite a sharp sell-off at month end, the S&P Europe 350 finished February with a gain of 2.7%, while the S&P United Kingdom rose 1.8% in pound sterling terms. Asian equities posted gains in February, with the S&P Pan Asia BMI up 1.7%. Government bonds sold off in February as investors digested a confluence of factors that look set to push inflation higher and could test central banks’ commitments to keep interest rates low for an extended period.

Equity exposure across all models reflects our view that markets are looking through the uncertainty of the pandemic and towards the resumption of more normal life once populations are vaccinated. In March, we maintained the asset allocation that we established in February. We continue to include some exposure to gold as a stabilizer in this volatile environment. Shorter duration fixed income has been maintained as the U.S. economy normalizes and inflationary pressures are rising.

The economic reopening and the global stimulus that is underway will lead to improved household liquidity, a wealth effect from rising asset values and lower consumption, healthy consumer balance sheets, and a healing labor market. Our approach to portfolio management is nimble, opportunistic, and deliberate in identifying asset classes that are best placed to generate returns in a new world order. Our focus is on protecting portfolios from downside risk, and we believe that our investment process is working to achieve that goal.


Deborah Frame, President and CIO


1 BCOM Index. December 1 to March 1, 2021.

2 Bloomberg WTI Index. February 21, 2021.

3 Trading Economics. China Debt, BIS Statistics. March 2021.

4 Trading Economics. Australia GDP. March 3, 2021.

5 European Centre for Disease Prevention and Control. March 17, 2021.

6 Trading Economics. Euro Area Inflation. March 17, 2021.

7 Trading Economics. U.S. Retail Sales. March 17, 2021.

8 Trading Economics. U.S. Housing Starts. March 16, 2021.

9 Trading Economics. U.S. Trade. March 17, 2021.

10 Trading Economics. Canada Inflation. March 17, 2021.


Index return data from Bloomberg and S&P Dow Jones Indices Index Dashboard: U.S., Canada, Europe, Asia, Fixed Income. February 28, 2021. Index performance is based on total returns and expressed in the local currency of the index.


The global economy has experienced a type of regime shift in response to the pandemic, and the recovery that follows will not be typical of historic recoveries following periods of recession and stagnation. Since the pandemic began, our outlook has been influenced by virus-related developments and fiscal stimulus, with consumer spending particularly sensitive to changes in these developments.  With our focus on this, we have changed our current twelve-month forward outlook to three months of Growth, followed by nine months of Stagnation, as we have seen evidence of a stronger recovery rebound since the start of the year.

Governments around the world are signaling that they will maintain fiscal support, with the U.S. administration set to lead the way by turning its attention to a multi-year infrastructure package. At the same time, major central banks are expressing a willingness to maintain accommodative stances despite a near-term inflation bounce, as they encourage an inflation overshoot and a rebound in inflation expectations. Incoming reports raise estimates of global GDP growth to 4% in 2021.1

China’s current account surplus widened to 2.0% of GDP in 2020, amounting to US$298.9 billion, compared to US$141.3 billion (1.0% of GDP) in 2019.2 On the merchandise trade front, China’s export sector was boosted by PPE and tech-related products. The steep decline in oil prices also cut China’s import bill by US$67.8 billion (or 26.5%) in 2020.3 In Western Europe, industrial activity and construction have continued to expand even as a weak service sector depresses GDP. Strong manufacturing is largely driven by the export-oriented German economy, where the manufacturing output index jumped 3.2%.4

In the U.S., the new stimulus package should boost an economy that is already off to a better-than-expected start to the year. The U.S. earnings season has been very strong, with the Q4 2020 earnings growth rate for the S&P 500 at 3.9%.5 Retail sales surged 5.3% in January.6 Manufacturing output continued to climb rapidly through January and most housing indicators showed strong levels of activity.  The Canadian economy (outside of the hospitality sector) continued to show resilience through the second wave of lockdowns as households and businesses adapted to tighter restrictions and the number of new COVID-19 cases continues to trend down. Retail sales were impacted by new containment measures but have remained resilient relative to the collapse in the spring. Manufacturing has been less severely impacted by the second wave of lockdowns with sales gradually converging back towards year-ago levels.

Global central banks have effectively taken interest rates to zero, driving nearly all sovereign debt to negative real yields. With less opportunity for yield across fixed income assets – especially those of shorter duration or higher quality – investors will likely continue to shift exposure to riskier assets. The S&P 500 posted a loss for January of 1.01%. Smaller caps outperformed, with the S&P MidCap 400 and the S&P SmallCap 600 up 1.5% and 6.3%, respectively. U.S. fixed income performance was mostly negative, particularly in corporates. Canadian equities posted losses, with the S&P/TSX Composite down 0.3%. The S&P Europe 350 erased its gains in the final day of January, leaving the continental benchmark with a total return of -0.8%. The S&P United Kingdom was down 0.6%. Asian equities began 2021 strongly. The S&P China 500 was up 4.8% and the S&P Hong Kong BMI was up 3.4%. Australian equities managed a gain with the S&P/ASX 200 up 0.3%, continuing a recent strong run which has seen it gain 12% over the last three months.

Equity exposure across all models reflects our view that markets are looking through the uncertainty of the pandemic and towards the resumption of more normal life once populations are vaccinated. In February, we shifted a portion of the gold exposure into U.S. Midcap Equities to reflect the updated outlook to near-term growth. Across the Conservative, Moderate Growth, Growth, and Aggressive Growth models, we added 8%, 10%, 12%, and 14% respectively. We continue to include some exposure to gold as a stabilizer in this volatile environment. Shorter duration fixed income has been maintained as the U.S. economy normalizes and inflationary pressures are rising.

The economic reopening and the global stimulus that is underway will lead to improved household liquidity, a wealth effect from rising asset values and lower consumption, healthy consumer balance sheets, and a healing labor market. Our approach to portfolio management is nimble, opportunistic, and deliberate in identifying asset classes that are best placed to generate returns in a new world order. Our focus is on protecting portfolios from downside risk, and we believe that our investment process is working to achieve that goal.


Deborah Frame, President and CIO


1 World Bank. Global Economic Prospects. January 2021.

2 Trading Economics. China Current Account. January 2021.

3 Trading Economics. China Imports. January 2021.

4 Trading Economics. Germany Exports. January 2021.

5 FactSet. Earnings Insight. February 26, 2021.

6 Trading Economics. U.S. Retail Sales. February 17, 2021.


Index return data from Bloomberg and S&P Dow Jones Indices Index Dashboard: U.S., Canada, Europe, Asia, Fixed Income. January 29, 2021. Index performance is based on total returns and expressed in the local currency of the index.


The global economy remains dominated by the global pandemic. While the world was hoping to see a conclusion with the launch of vaccines as we entered 2021, rising COVID-19 cases and a more infectious new variant of the virus have created a renewed sense of caution. There have been over 94 million documented cases of COVID-19 and over 2 million deaths reported globally.1 The global economy has been plunged into its deepest recession since the Second World War. A combination of fiscal and monetary policy support will generate growth recovery, but we are maintaining our twelve-month forward forecast of Recession as we do not yet see the recovery overtaking the negative impact of the pandemic that currently prevails.

Growth in China decelerated to an estimated 2.3% in 2020 – the slowest pace since 1976.2 The recovery has been uneven as import growth lagged a rebound in exports, contributing to a widening current account surplus. Accommodative fiscal and monetary policies have resulted in an increase in the government deficit and total debt.3 The Euro area and U.K. economies are projected to contract as they implement more expansive lockdown measures, with sectors like tourism likely to remain depressed. Euro area consumer confidence dropped 1.6 pts to -15.5 in January, which left the survey low by historical standards.4

The U.S. economy is stronger than most other global economies while it continues to experience an uneven recovery. The fall in U.S. activity in the first half of 2020 was nearly three times as large as the peak decline during the global financial crisis, underscoring the depth of the recession.5 Substantial fiscal support to household incomes – far exceeding similar measures delivered during the global financial crisis – contributed to a robust initial rebound in the third quarter of 2020, which was subsequently cut short by a broad resurgence of the pandemic. In Canada, COVID-19-related metrics have been improving and vaccines continue to be rolled out. The Bank of Canada kept all aspects of monetary policy unchanged in January, including the policy rate (0.25%), C$4 billion weekly QE program, and the outcome-based forward guidance.

Despite the COVID-19 pandemic and the uncertainty of an election year, U.S. equities ended the year with the S&P 500 posting a gain of 18.4% for 2020. Smaller caps reversed course by outperforming in Q4, with the S&P MidCap 400 and S&P SmallCap 600 up 13.7% and 11.3% for the year, respectively. Canadian equities ended the year with modest gains, with the S&P/TSX Composite up 5.6% for 2020. European equities finished 2020 down 2.8% thanks to the United Kingdom, down 12.9% after agreeing to “Brexit”. The S&P Europe 350’s total return would have been a 2% gain were it not for the negative contribution of British stocks. The Euro gained 6% versus sterling and 8% vs the US Dollar during 2020. Asian equities recovered after being devastated by COVID-19 in March, with the S&P Pan Asia BMI up 20% for the year. All Asian single-country indices posted gains, with Korea and Taiwan in the lead. Rates on both sides of the Atlantic fell, pushing major sovereign yields further into negative territory across the Eurozone. European bonds outperformed equities, with risker credits top of the performance charts. U.K. bonds also performed well, more in local terms than euros.

In January, we maintained the asset allocation that was established in December for all models. Within Equities, we eliminated our position in U.S. MidCap Equities in the Growth and Aggressive Growth models and established a position in Australian Equities to replace it as the COVID-19 vaccine is being rolled out there quickly, the Government and Reserve Bank are pumping more stimulus into the economy, and the hardest-hit sectors are making a recovery. Equity exposure across all models reflects our view that markets are looking through the uncertainty of the pandemic and towards the resumption of more normal life once the population is vaccinated. We continue to favor shorter duration fixed income. With interest rates low or negative, we have maintained exposure to gold.

The COVID-19 pandemic is a global crisis that necessitates a coordinated global response. It is likely to steepen the slowdown in potential growth, undermining prospects for labor productivity and poverty reduction. Limiting the spread of the virus, providing relief for vulnerable populations, and overcoming vaccine-related challenges are immediate priorities. Only when the pandemic is effectively managed in all countries will individual countries be safe from resurgence, allowing global growth outcomes to improve materially. Our approach to portfolio management is nimble, opportunistic, and deliberate in identifying asset classes that are best placed to generate returns in a new world order. Our focus is on protecting portfolios from downside risk, and we believe that our investment process is working to achieve that goal.


Deborah Frame, President and CIO


Johns Hopkins University. National Public Health Agencies. January 18, 2021.

Trading Economics. China GDP. December 2020.

The World Bank. 2021 Global Economic Prospects. January 2021 (figures 1.10.C and 1.10.D).

Trading Economics. Euro Consumer Confidence. January 21, 2021.

Trading Economics. U.S. GDP Growth Rate. January 2021.


Index return data from Bloomberg and S&P Dow Jones Indices Index Dashboard: U.S., Canada, Europe, Asia, Fixed Income. December 31, 2020. Index performance is based on total returns and expressed in the local currency of the index.


Section 1: Q1 2021 Outlook


We Expect an Uneven Recovery and a Prolonged Global Recession

While the world was hoping to see the conclusion of the global pandemic as we entered 2021, instead, we find ourselves more in the middle of the cycle. The pandemic has plunged the global economy into its deepest recession since the Second World War, killing millions and freezing economies across multiple continents. As we enter 2021, there have been over 94 million documented cases of COVID 19 and over 2 million deaths reported globally.i

The impact of weakened fundamental drivers of growth, will steepen the slowdown in labor productivity over the next decade. The pandemic is likely to steepen the long-expected slowdown in potential growth, undermining prospects for labor productivity and poverty reduction. Limiting the spread of the virus, providing relief for vulnerable populations, and overcoming vaccine-related challenges are key immediate priorities.

International bodies, such as the World Health Organization and the Group of Seven, that had been relied upon for a game plan to coordinate a global attack on a global pandemic, proved to be incapable of delivering. Adding to the disaster has been the propensity for the gaps in scientists’ understanding of COVID-19 that have been filled by opportunists.


2020: Teetering Between Recovery and Chaos

From the early months of the pandemic in the spring of 2020, the nature of exponential growth of infections led to a doubling every five or six days. A majority of countries failed to anticipate how they would deal with the spread. Italy’s advanced health-care system collapsed under the burden of cases in March as other countries delayed. Britain went into lockdown two weeks after Italy. During that time infections multiplied between four and eight times. In contrast, Asian countries, such as Taiwan, Singapore, and Vietnam drew on their experience of earlier coronaviruses and acted early and effectively.

Entering April, in response to the global spread, the world underwent a de-globalization as borders closed and travel virtually ceased. And as anticipated, a second wave that was more rampant than the first wave of the virus occurred in the fall. Despite having had months to prepare, governments failed to see the crisis coming for a second time.

Moving forward, the vaccine is a game-changer, allowing restrictions to begin to be lifted. The news of a rollout in record time has brought hope to the situation. The most immediate risk is that the rollout of vaccines is slower than the spread of the virus, held back by bottlenecks in production, or more likely, distribution and administration. As of December 30th, 2.8 million doses of vaccine had been administered in the U.S., a rate at which it will take four full years to vaccinate the entire population. Hopefully this will change as supply chain issues are ironed out and the incoming Biden Administration takes a much more proactive stance. Assuming that there is no virus mutation, by the end of 2021 it is hoped that much of the Western population will have been vaccinated. Western economies can only then begin to return to their long-term trend growth.


Underlying Geopolitical Challenges

2020 saw the deepest global economic setback of the post-war era. Political dysfunction became a way of life in the U.S. and elsewhere. Record joblessness in North America, second and third virus waves, U.S. civil unrest, a near-war with Iran, simmering trade and tech tensions with China, a Russian hack, Brexit uncertainty (again), and an endless U.S. election cycle that then required four days to declare a winner are notable events that followed a profoundly traumatic decade. Underlying challenges were made worse by the economic stress caused by the virus.

• Democracy receded from the heights of the post-Cold War era, retreating in more places than it advanced,
• Brexit and surging populism threatened European integration, one of the defining endeavors of the post-World War II era,
• Globalization encountered fierce political and geopolitical headwinds, as the World Trade Organization become gridlocked,
• China’s economic rise grew more ominous, and
• America became an uncertain advocate of free trade.

COVID-19 is expected to increase global inequality, both within and between countries.

Within countries, the pandemic has hit lower-paid workers particularly hard – the informally employed, women, immigrants, and the low-skilled. Lower-income workers tend to be less able to work from home than higher-income workers and are more likely to be exposed to the pandemic at work and are more vulnerable to job or income losses due to lockdowns.ii The share of lower-paid workers is higher in essential services where workers are more exposed to the pandemic. Social benefits may fail to reach middle income households that have suffered income losses but are outside existing poverty alleviation programs.iii

With regard to inequality between countries, lower-income countries tend to have large informal sectors that concentrate in activities, and operate in facilities, that require close interactions and are particularly vulnerable to pandemic-related disruptions. In addition to causing losses in output levels, the pandemic has set back fundamental drivers of long-term output growth – investment, improvements in education and health, and increases in female labor force participation. Weakening fundamental drivers of growth will be reflected in lower potential growth prospects over the 2020s.


Government Debt and Fiscal Policy Risks

A number of risks related to the pandemic will add to the collateral damage and make the recovery more uneven. These include the rising debt levels in global economies as well as the debt resulting at the corporate level as pandemic related weakness impacts many sectors.

When COVID-19 first began to spread around the world in the spring of 2020, this health emergency risked triggering an economic and financial crisis. America’s financial mechanisms froze as companies scrambled for cash, dumping even their holdings of usually safe Treasuries. Companies and investors the world over rushed into dollars. The bottom fell out of the oil market as demand collapsed. In April the futures price for West Texas Intermediate crude went negative, declining to -$37 per barrel.

As countries locked down, they experienced their deepest downturns in recent memory. But financial panic was averted. The banks stayed resilient. Part of that is a consequence of regulation after the global financial crisis. Fiscal stimulus, government credit guarantees, and central bank action have prevented many losses from occurring. The Federal Reserve stepped into Treasury and corporate-bond markets, a sign of the growing importance of capital markets as a source of credit. The stimulus helped Wall Street, even as Main Street suffered. By August, and again towards the end of the year, the S&P 500 stock market index was hitting record highs. The exuberance was at first concentrated around the sorts of companies, such as those in tech and health care, that did well out of the pandemic. But as news of an effective vaccine broke in early November, it rippled out to emerging markets.

The pandemic has exacerbated the risks to Main Street associated with a decade-long wave of global debt accumulation. Debt levels have reached historic highs, making the global economy particularly vulnerable to financial market stress. There is now almost universal agreement among governments and central banks over the need to maintain fiscal and monetary support until recoveries are entrenched. As a result of sharp output collapses, unprecedented policy stimulus across global economies has led to debt-to-GDP ratios that are set to reach new highs. Global government debt is expected to have reached 99 percent of GDP for the first time on record in 2020.iv

The COVID-19 pandemic is likely to deepen and prolong a slowdown in output, productivity, and investment growth that has been underway for a decade. Weak growth will further increase debt burdens and erode borrowers’ ability to service debt. For some countries in debt distress, the economic outlook may only improve once debt relief via debt write-offs occurs, rather than rescheduling. Pre-emptive debt restructurings have generally been associated with better macroeconomic outcomes rather than restructurings that occur after a default has occurred.v

2020 fiscal easing outstrips 2009 although the amount varies across regions, resulting in divergent growth. Among Emerging Market and Developing Economies (EMDEs), total debt had risen by about 7 percentage points of GDP each year since 2009. In 2020, government debt alone is expected to rise by 9 percentage points of GDP, the most since a series of late 1980s debt crises while corporate indebtedness is also likely to sharply increase.vi

The pandemic has made this wave of debt more dangerous by increasing its risky features. The sheer magnitude and speed of the debt buildup heightens the risk that not all of it will be used for productive purposes. Previous waves of debt have ended with widespread financial crises. When debt resolution was protracted, growth was often slow to recover or even resulted in a lost decade of growth. There is a risk that this fourth wave of debt since 1970, like its predecessors, also ends with a major financial crisis, with some countries already experiencing debt distress.

Since 1970, about half of all countries that experienced a rapid buildup of debt also experienced a financial crisis. Where debt accumulation episodes were accompanied by crises, output and investment were significantly lower even several years after the end of the episode than in countries without crises.vii

A different but related risk is that ultra-loose monetary policies have led to a misallocation of capital that ultimately threatens the stability of the financial system in one or several major economies. This is possible – history shows how a combination of easy money and liberalized capital markets can cause asset price bubbles to inflate, which can then cause economic and financial market dislocation when they burst. This process typically plays out over years. While it is worth keeping at least one eye on China’s property market, we think that the valuation of major asset classes (including equities) can for now be justified in the context of lower interest rates.


Uneven Economic Recovery in 2021

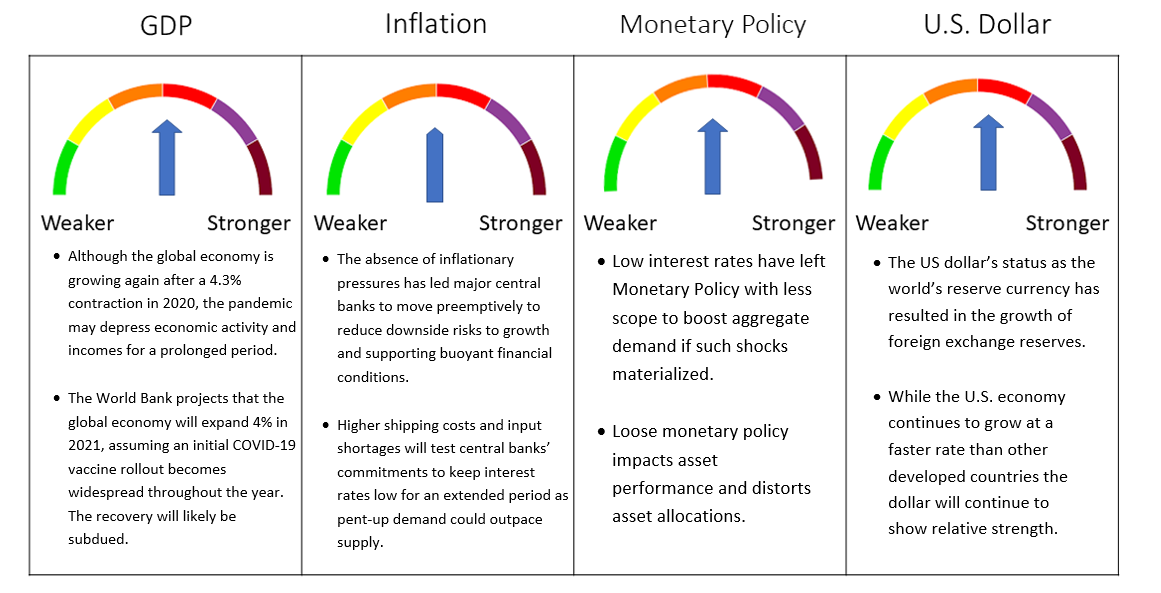
Although the global economy is emerging from the collapse triggered by COVID-19, the recovery is expected to be slow and global GDP is expected to remain below pre-pandemic levels for all of 2021 and 2022. Recessions that feature financial crises are significantly deeper and longer than recessions that do not.viii Against this backdrop, widespread financial crises, combined with a prolonged pandemic and delayed vaccination, could result in a double-dip global recession, with a further contraction in activity this year.

Throughout the second half of 2020, world trade rebounded strongly. The recovery to date has largely played out in the goods economy much more than in services, as consumers can carry on with purchases from home while other activities requiring face-to-face interactions, such as leisure and travel, are more challenging to resume.

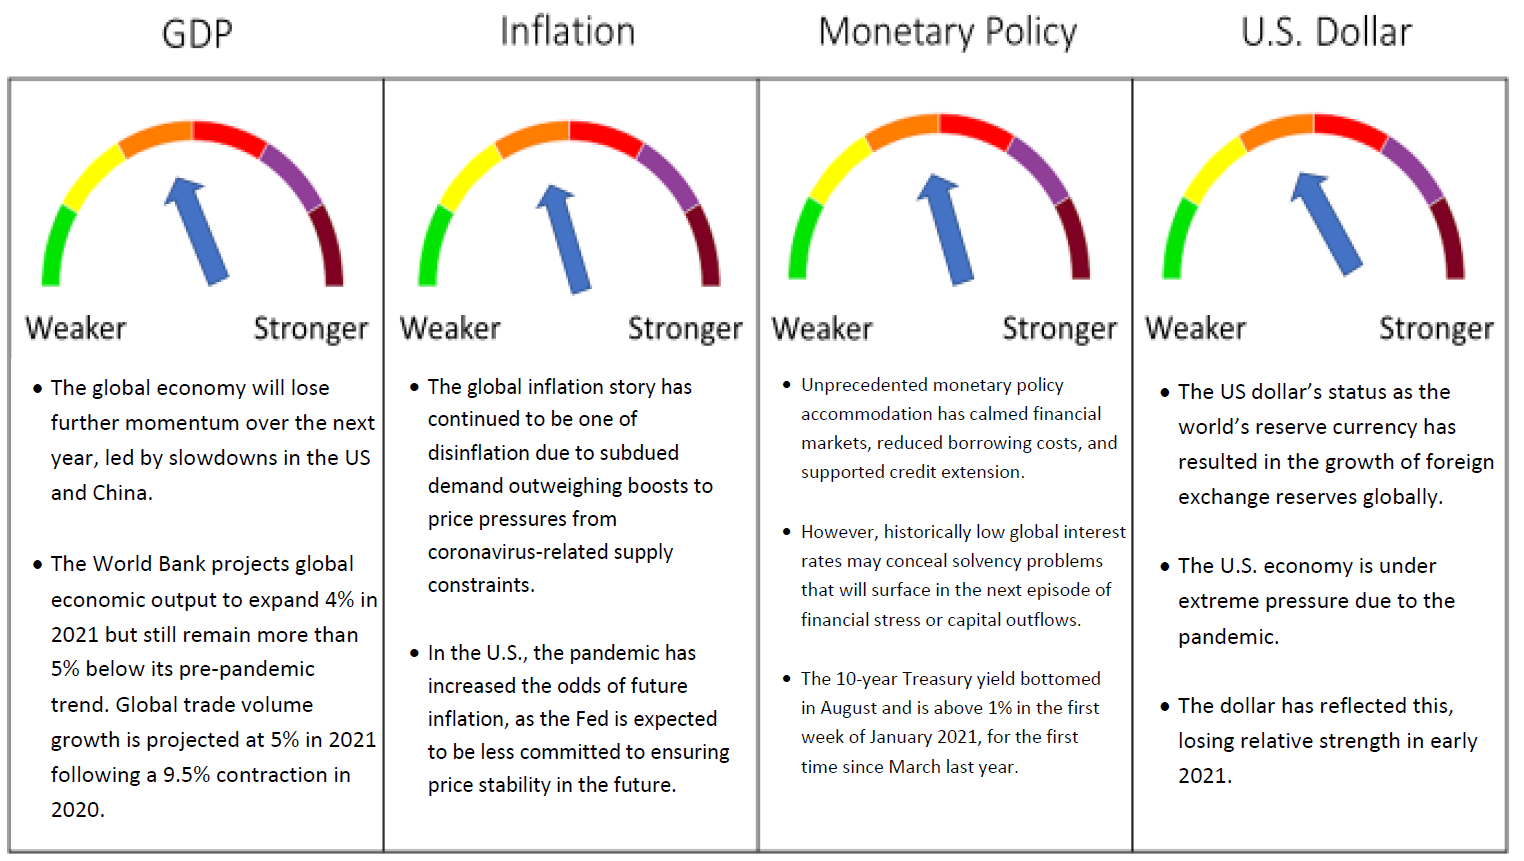
According to the World Bank Global Economic Prospects, published in January 2021, the World Bank projects global economic output to expand 4% in 2021 but remain more than 5% below its pre-pandemic trend. They also project global trade volume growth at 5% in 2021 following a 9.5% contraction in 2020.

Global growth is projected to moderate to 3.8% in 2022, weighed down by the pandemic’s lasting damage to potential growth. In particular, the impact of the pandemic on investment and human capital is expected to erode growth prospects in emerging market and developing economies (EMDEs) and set back key development goals.

In the baseline scenario, global output in 2025 would be about 5% below the pre-pandemic trend and there would be a cumulative output loss during 2020-25 equivalent to 36% of 2019 global GDP.

In addition to causing losses in output levels, the pandemic has set back fundamental drivers of long-term output growth – investment, improvements in education and health, and increases in female labor force participation. Weakening fundamental drivers of growth will be reflected in lower potential growth prospects over the 2020s. The World Bank projects global potential growth would slow by another 0.3 percentage points a year compared with pre pandemic trends, to 1.9% a year over 2020- 29, below the 2.1% a year expected before the pandemic.


Global Prospects

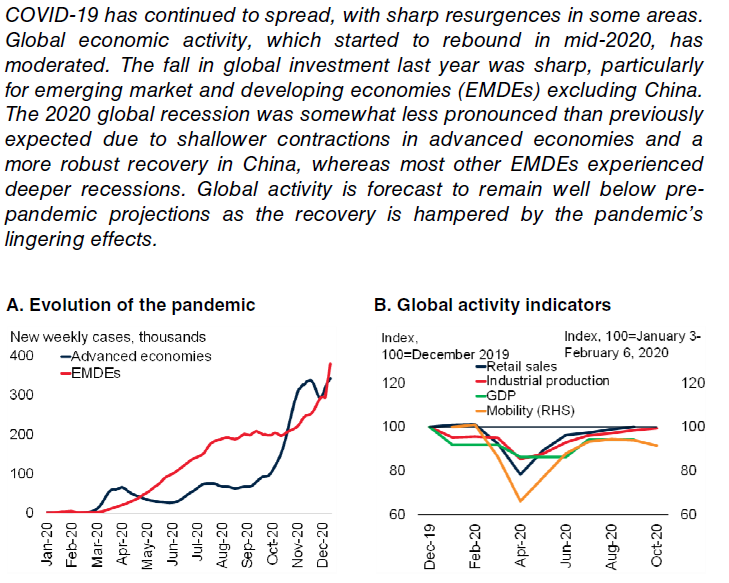
SOURCES: COVID-19 COMMUNITY MOBILITY REPORTS (DATABASE); HAVER ANALYTICS; OUR WORLD IN
DATA (DATABASE); WORLD BANK.


Like human capital accumulation, infrastructure investment raises growth directly by increasing the capital stock and indirectly through its collateral benefits for productivity. Good infrastructure investment can raise productivity by improving competitiveness, lowering production costs, facilitating trade, strengthening human capital, and encouraging innovation and knowledge diffusion. For example, better transportation networks can reduce the cost and time of new construction and installation of new equipment, and improved access to electricity and better sanitation can raise educational attainment and public health standards.

The World Bank Global Economic Prospects Report includes two adverse scenarios; one where new infections remain elevated in much of the world, and a second where vaccination delays re-ignite financial stress that spurs widespread corporate and sovereign defaults. Such outcomes could mean just 1.6% growth this year or even another global contraction.

A more prolific pandemic could lead to even larger income losses. In a downside scenario of persistently higher caseloads and delayed vaccination, global output in 2025 would be about 8% below earlier expectations, and there would be a cumulative loss equivalent to 54% of 2019 global output. Delays in vaccine deployment could disappoint financial markets and trigger a repricing of risks. Amid record-high debt, higher borrowing costs could tip many firms into bankruptcy, weakening bank balance sheets, possibly to an extent that could trigger a financial crisis. In such a severe downside scenario, the report projects that global output could contract by another 0.7% in 2021. Cumulative output losses over 2020-25 could amount to 68% of 2019 output globally.

The International Monetary Fund in October slightly lowered its 2021 growth forecast to 5.2%, warning that despite massive stimulus from central banks and governments the world still faces an uneven recovery until the virus is tamed.


Country Level Outlook

The U.S. economy remains stronger than most other global economies. The fall in U.S. activity in the first half of 2020 was nearly three times as large as the peak decline during the global financial crisis, underscoring the depth of the recession. For 2020, U.S. output is estimated to have fallen by 3.6%. Although the pandemic’s economic impact was not as severe as envisioned in previous projections, last year’s contraction was more than one percentage point larger than that of 2009.

Substantial fiscal support to household incomes – far exceeding similar measures delivered during the global financial crisis – contributed to a robust initial rebound in the third quarter of 2020, which was subsequently cut short by a broad resurgence of the pandemic. The 2021 U.S. growth forecast was cut to 3.5% from 4% in June on subdued demand seen in the early part of the year amid new restrictions and a broad virus resurgence.ix

The near-term outlook for other countries including Canada remains clouded by the resurgence in infections and lockdown measures which are weighing heavily on economic activity. While Canada and the U.S. are expected to cross the finish line of 2020 with gains, the Euro area and U.K. economies are projected to contract given more expansive lockdown measures. Substantial monetary and fiscal policy support will underpin modest growth in all four economies in early 2021 with the momentum building as more people are vaccinated, restrictions ease, and confidence improves.

Other highlights from the World Bank report include:

• Euro area projection reduced to 3.6% from 4.5% following stringent lockdowns, with sectors like tourism likely to remain depressed.
• Latin America estimate raised to 3.7% from 2.8% on prospects for restrictions easing, faster vaccinations in the second half, and rising oil and metal prices.
• Many emerging countries had less fiscal room to offer big handouts and as a consequence may suffer greater economic damage.
• Subdued demand and heightened economic uncertainty, combined with disruptions to schooling and employment, are weighing heavily on labor productivity.


Conclusion

The history of the pandemic has been one of hope over experience, with governments anticipating that lockdowns will be short-lived but then retreating as the virus spreads in ways that we failed to envisage.

Policy support from both central banks and governments will eventually lead to the transition to a sustainable recovery. With weak fiscal positions severely constraining government support measures in many countries, it will be a challenge to recover with sustainable and equitable growth.

The COVID-19 pandemic is a global crisis that necessitates a coordinated global response. Only when the pandemic is effectively managed in all countries will individual countries be safe from resurgence, allowing global growth outcomes to improve materially. We expect emerging markets will continue to outpace advanced economies.

Global cooperation is critical in addressing many of these challenges. The global community needs to make sure the ongoing debt wave does not end with a string of debt crises in EMDEs, as was the case with earlier waves of debt accumulation.


Section 2: Four Themes


Theme 1: China

China is on track for its slowest growth since the Mao era, although set against the gloomy global backdrop, economic performance has been exceptional. Structural weaknesses in China’s economy – demographics, rising debt burdens and diminishing returns on investment – are currently being papered over with stimulus.

Growth in China decelerated to an estimated 2% in 2020 – the slowest pace since 1976. It could have been worse but has been helped by effective control of the pandemic and public investment-led stimulus. Accommodative fiscal and monetary policies led to a sharp increase in the government deficit and total debt. Fiscal policy support, which initially focused on providing relief and boosting public investment, is starting to moderate. The recovery has been uneven as import growth lagged a rebound in exports, contributing to a widening current account surplus.

According to the World Bank Report, growth is forecast to pick up to 7.9% in 2021, above previous projections due to the release of pent-up demand, and to 5.2% in 2022 as deleveraging efforts resume. Even as GDP returns to its pre-pandemic level in 2021, it is still expected to be about 2% below its pre-pandemic projections by 2022.

We remain concerned about China’s rising debt and uneven recovery.


Theme 2: Interest Rates

The pandemic led to a global recession as governments shut down large segments of their economies in an effort to slow the spread of the virus. Unprecedented monetary policy accommodation has calmed financial markets, reduced borrowing costs, and supported credit extension. However, historically low global interest rates may conceal solvency problems that will surface in the next episode of financial stress or capital outflows.

At the onset of the pandemic, short-term interest rates fell as central banks reduced short-term policy rates. The Federal Reserve, for example, reduced the federal funds rate (that is, the interest rate that financial institutions charge each other for overnight loans of their monetary reserves) from 1.6% to near zero over a two-week span in early to mid-March.

Long-term interest rates fell as well, as central banks, including the Federal Reserve, made direct purchases of long-term securities and instituted a number of lending programs aimed at maintaining the functioning of financial markets. Additional downward pressure on long-term interest rates came from investors shifting out of risky assets, such as equities, and into safe assets, such as U.S. Treasury securities. Rates were also held down by the fall in demand for investment as firms postponed and cancelled capital expenditure projects.

The 10-year Treasury yield bottomed in August and is above 1% in the first week of January 2021, for the first time since March last year. This follows the Georgia Senate run-off election and an ensuing rise in the chance that the Biden administration passes further fiscal stimulus. The recent rise in rates has effectively been a tightening but the Fed is unlikely to let monetary conditions continue to tighten, as the economy continues to recover. Yields have edged up in the U.K., but not to the same extent as in the U.S. The recovery in risky assets has continued to push down corporate bond spreads, below their pre-virus levels. The next round of fiscal stimulus is expected to assist the state and local government sector. Munis are attractive as a result and have rallied as Treasuries sold off.

The rise in market rates and steepening yield curve is a big plus for financials, especially for the regional banks which will not face any regulatory risk. There is concern over commercial real estate exposure, but that is really a problem that commercial mortgage-backed securities and structured finance players will confront.

We continue to have concerns that asset prices have been driven up by exceptionally loose monetary policy and that they will reverse once central banks start to raise real interest rates back towards their historical levels. At the same time, the equilibrium level of real interest rates is lower than in the past and this is expected to cushion and correction.


Theme 3: Inflation

In general, the global inflation story has continued to be one of disinflation due to subdued demand outweighing boosts to price pressures from coronavirus-related supply constraints. Deflationary pressures from technology are likely to remain muted. Inflation rates are subdued, as they have been for the past decade, but stimulus and demographic trends could prompt a comeback. Higher public debt burden, slower global labor force growth, and the possibility that globalization will be partly reversed, will lead to a gradual rise in inflation over the longer-term. In the near term, with oil prices around $55 per barrel, base effects will ensure a jump in energy price inflation on the anniversary of last April’s collapse in oil prices.

In the U.S., the pandemic has increased the odds of future inflation, as the Fed is expected to be less committed to ensuring price stability in the future. There is no other central bank as openly committed to policy easing as much as the Fed, and no other central bank boosting the monetary aggregates at the same pace. The Fed has stated that it will not touch rates for three more years even if inflation crosses above 2% and the jobless rate drops below 4%. 3% inflation is something the central bank would be fine with. That would imply a prolonged period of negative real rates, which should be bullish for long-duration assets, bullish for hard assets, and bearish for the dollar.


Theme 4: Commodities

Energy and Gold Prices in 2021

Oil prices partially recovered over the second half of 2020 as production fell sharply. This rebound was more modest than the broader recovery in commodity prices as oil demand disappointed while the rise in other commodity prices was mainly driven by strong demand from China. We expect the demand for oil in 2021 to remain subdued and prices to stay within the current range.

Gold was one of the best performing major assets of 2020 driven by a combination of high risk and low interest rates. Given our more cautious outlook for the speed of the recovery, compared to a crypto currency like bitcoin, the risk that gold could go to zero does not exist as there is a floor in its price, because it has physical properties that make it useful even outside of its primary function as a safe-haven asset. Bitcoin, which has marginal intrinsic value, relies on the faith of its holders that it is worth more than nothing and that the technology is sound. We note that the volatility of bitcoin is five times that of gold.

We do not expect to see a strong rebound in energy prices from here but the environment that we have described may result in strong gold investment demand, which could offset low consumption as it did during 2020. We believe there are strong arguments for holding a portfolio that includes hard assets such as gold, things that will keep their value in the face of the ongoing risks that we have discussed in this Outlook.


Section 3. Investment Outlook


Global Pandemic Leads Us to a Recession Forecast for the Next Twelve Months


SOURCE: FRAME GLOBAL ASSET MANAGEMENT


Frame Global Asset Management considers these trends and factors them into our outlook for the economy in our twelve-month forward period. We look back to periods of similar economic behavior and use this information to predict the future behavior of the asset classes that we consider. Our investment process allows us to adapt for non-traditional monetary policy and other exogenous variables.


Section 4. December 2020 Portfolio Models

COVID-19 has wreaked havoc on the world economy, which is set to contract the most since WWII this year as governments shut down large segments of their economies to slow the spread of the virus. There are some signs of recovery as the latest data from the CPB Netherlands Bureau for September showed that real world trade in goods was just 1.5% below its December 2019 level. We have maintained our Recession outlook over our forecast horizon of the next 12 months.

In December, we maintained the asset allocation that was established in November for all models. We continue to favor shorter duration fixed income. With interest rates low or negative, we have maintained exposure to gold. Equity exposure across all models reflects our view that markets are looking through the uncertainty of the pandemic and towards the resumption of more normal life once the population is vaccinated.

We are closing in on the end of a year that introduced the current global pandemic, triggering the deepest global economic setback of the post-war era, record joblessness in North America, second and third virus waves, U.S. civil unrest, a near-war with Iran, trade and tech tensions with China, a Russian hack, Brexit uncertainty (again), and an endless U.S. election cycle that then required four days to declare a winner. The pandemic is unfortunately not over as we enter 2021.


Deborah Frame, CFA, MBA

President and Chief Investment Officer

January 14, 2021


iJohns Hopkins University. National Public Health Agencies. January 18, 2021.
iiWorld Bank. 2021. Global Economic Prospects, January 2021. Washington, DC: World Bank. doi: 10.1596/978-1-4648-1612-3. License: Creative Commons Attribution CC BY 3.0 IGO.
iiiWorld Bank. 2021. Global Economic Prospects, January 2021.
ivWorld Bank. 2021. Global Economic Prospects, January 2021.
vWorld Bank. 2021. Global Economic Prospects, January 2021.
viWorld Bank. 2021. Global Economic Prospects, January 2021.
viiWorld Bank. 2021. Global Economic Prospects, January 2021.
viiiWorld Bank. 2021. Global Economic Prospects, January 2021.
ixWorld Bank. 2021. Global Economic Prospects, January 2021.

COVID-19 has wreaked havoc on the world economy, which is set to contract the most since WWII this year as governments shut down large segments of their economies to slow the spread of the virus. There are some signs of recovery as the latest data from the CPB Netherlands Bureau for September showed that real world trade in goods was just 1.5% below its December 2019 level. Confidence in the timeliness and effectiveness of a Covid-19 vaccine has contributed to confidence that we can return to a kind of ‘New Normal’. The success of this will depend on finding an acceptable trade-off between public health, the economy, and personal freedom.

China was likely the only major economy to grow in 2020, as it had more time to recover from the coronavirus hit. Structural weaknesses in China’s economy (demographics, rising debt burdens, and diminishing returns on investment) are currently being papered over with stimulus. The Chinese economy is tilted towards goods production and less on services, also benefiting GDP.

The ECB has just expanded its pandemic emergency purchase program (PEPP) by €500 billion to a total of €1,850 billion and extended the horizon to at least the end of March 2022.1 The United Kingdom will begin 2021 with a fresh start on trade and will freely negotiate trade agreements on its own. In January, the EU’s Common External Tariff will be replaced with the U.K. Global Tariff, which will apply to imported goods from countries without an existing trade agreement.

In December, the U.S. Federal Reserve decided to maintain the target range for the federal funds rate at 0.00% to 0.25%.2 The Fed will continue to increase its holdings of Treasury securities by at least US$80B per month and of agency mortgage-backed securities by at least US$40B per month until further progress has been made toward the Fed’s maximum employment and price stability goals. Retail sales were down 1.1% in November, after falling 0.1% in October and gaining 1.7% in September.3 Regional manufacturing indexes decreased in December. Housing starts rose 1.2% in November after gaining 6.3% in October.4 The number of Americans filing for unemployment benefits decreased to 803,000 in the week ended December 19th, from the previous week’s three-month high of 892,000. Claims remained well above the 200,000 level reported back in February.5 The Canadian real GDP surprised mildly to the high side of expectations with a 0.4% advance in October.6

Global equities posted their highest monthly return since the turn of the century in November. All 50 countries included in the global benchmark gained as prospects for overcoming COVID-19 considerably improved. U.S. markets saw their best performance since April. The S&P 500 gained 10.9% while smaller caps outperformed, with the S&P MidCap 400 and S&P SmallCap 600 rising 14.3% and 18.2%, respectively. Canadian equities posted strong performance in November, with the S&P/TSX Composite up 10.6%. European equities surged in November. The S&P Europe 350 had its best month ever, posting a total return of 14.2%. The S&P United Kingdom gained 13.3% as investors brushed off the fast-approaching year-end deadline for a trade agreement with the E.U. to avoid a no-deal exit from the trading bloc. Asian equities soared in November, with the S&P Pan Asia BMI up 10.4%. S&P Singapore BMI led the group up 15.2%, followed by S&P Korea BMI up 14.6%. Investment demand for gold via ETFs remains strong while gold has returned more than 20% in 2020 as of December 28.

In December, we maintained the asset allocation that was established in November for all models. We continue to favor shorter duration fixed income. With interest rates low or negative, we have maintained exposure to gold. Equity exposure across all models reflects our view that markets are looking through the uncertainty of the pandemic and towards the resumption of more normal life once the population is vaccinated.

We are closing in on the end of a year that introduced the current global pandemic, triggering the deepest global economic setback of the post-war era, record joblessness in North America, second and third virus waves, U.S. civil unrest, a near-war with Iran, trade and tech tensions with China, a Russian hack, Brexit uncertainty (again), and an endless U.S. election cycle that then required four days to declare a winner. The pandemic is unfortunately not over as we enter 2021. Our approach to portfolio management is nimble, opportunistic, and deliberate in identifying asset classes that are best placed to generate returns in a new world order. Our focus is on protecting portfolios from downside risk, and we believe that our investment process is working to achieve that goal.


Deborah Frame, President and CIO


Trading Economics. ECP Emergency Purchase Program. December 10, 2020.

Trading Economics. U.S. Fed Funds Rate. December 16, 2020.

Trading Economics. U.S. Retail Sales. December 16, 2020.

Trading Economics. U.S. Housing Starts. December 17, 2020.

Trading Economics. U.S. Unemployment. December 4, 2020.

Trading Economics. Canada GDP Month over Month. December 23, 2020.


Index return data from Bloomberg and S&P Dow Jones Indices Index Dashboard: U.S., Canada, Europe, Asia, Fixed Income. November 30, 2020. Index performance is based on total returns and expressed in the local currency of the index.


Global growth momentum continued into October, as industrial activity and trade readings from the U.S., China, and Japan pointed upward. Good news regarding various vaccine trials increased confidence that the pandemic will be less of a drag by Q2 2021. In the near term however, downward revisions to growth reflect recent restrictions on activity across several U.S. states and across developed markets including Canada, the Euro area, Japan, and the U.K. We expect to see global GDP contract in Q4 2020 and Q1 2021, followed by a slow recovery. As we do not see a clear path through the chaos resulting from the COVID-19 pandemic, traditional business cycle analysis does not fit. Rather, this is in line with the shock of a natural disaster. We have maintained our Recession outlook over our forecast horizon of the next 12 months.

In China, virus management has largely been successful. The Chinese economy’s first-in, first-out status regarding the COVID-19 shock is clear in the swings in its industrial activity. After plunging 13.5% year over year in February, industrial production growth resumed when factories re-opened and workers returned with IP expanding by 6.9% year over year in October.1

The renewed lockdowns in Europe appear to be turning the tide on the surge in infections. Countries that have put aggressive restrictions in place, like France, Spain, and Belgium, have seen the greatest improvement. On November 5, the Bank of England announced it would inject £150 billion into the U.K. economy to help soften the impact of the new lockdown. Large fiscal supports there have pushed the deficit close to 11% of GDP this year.2

In the U.S., October’s durable goods data suggest the economy started the fourth quarter on a strong footing, but the second consecutive weekly rise in initial jobless claims is a warning sign that the latest spike in coronavirus cases has triggered a new bout of economic weakness. U.S. jobs fell 9.3% from their peak and have recovered less than half of this decline thus far.3 Close to 10 million U.S. workers are likely to lose their unemployment benefits at the start of next year, amounting to an income loss of roughly $170 billion annualized.4 Durable goods orders increased by 1.3% month over month in October.5 On a three-month annualized basis, core CPI inflation is running above 2%.6 Of the $750 billion of combined funds in the two major Fed purchasing programs, the Fed used only $13 billion by the end of September, encouraging corporate bond issuance, and creating high yield bond demand.7 We expect a fiscal response by way of a stimulus package in Q1 2021. Canada saw a surge in its COVID-19 cases following its October Thanksgiving, which sends a worrisome signal for the U.S. holidays. As provincial authorities have tightened restrictions, growth is expected to stall next quarter.

News of the high effectiveness of the Pfizer and Moderna vaccines helped push the S&P 500 to a record high and caused longer dated Treasury yields to rise closer to 1%, even as the Fed’s commitment to low interest rates kept short-term interest rates anchored near zero. The S&P 500 declined 2.7% in October, as concerns mounted over rising coronavirus infections, mixed earnings results, and the Presidential and Congressional elections. Smaller cap stocks outperformed, with the S&P Mid Cap 400 and the S&P SmallCap 600 rising 2.2% and 2.6%, respectively. The Canadian S&P/TSX Composite was down 3.1%. European equities slid sharply lower after a resurgence in cases of COVID-19 led to increased restrictions across the continent. The S&P Europe 350 dropped 5.0% on the month. The S&P United Kingdom declined to finish the month with a loss of 5.0%, as Brexit negotiations continued to drag on and the government attempted to fine-tune virus control measures by region. Emerging Markets gained 2.04% as measured by the S&P Emerging BMI. The risk-on mood in markets has further undermined the dollar, which on a trade-weighted basis, has hit an 18-month low.

In November, we maintained the asset allocation that was established in October for all models. While continuing to favor shorter duration fixed income, we shifted exposure from Mortgage-Backed Bonds that have been supported by the Fed asset buying program to Municipal Bonds that will benefit from expected fiscal spending on infrastructure. With interest rates low or negative, we have maintained exposure to gold. Equity exposure across all models reflects our view that markets are looking through the uncertainty of the pandemic and towards the resumption of more normal life once the population is vaccinated.

There are numerous catalysts for market volatility in the fourth quarter with the primary one being the premature withdrawal by governments seeking to repair some of the damage to public finances. Our approach to portfolio management is nimble, opportunistic, and deliberate in identifying asset classes that are best placed to generate returns in a new world order. Our focus is on protecting portfolios from downside risk, and we believe that our investment process is working to achieve that goal.


Deborah Frame, President and CIO


Trading Economics. China Industrial Production. November 16, 2020.

Trading Economics. U.K. Government Budget. November 2020.

Trading Economics. U.S. Employment. November 2020.

Trading Economics. U.S. Employment Forecast. November 2020.

Trading Economics. Durable Goods Orders. November 25, 2020.

Trading Economics. U.S. CPI. November 2020.

The Federal Reserve. FOMC notes. November 5, 2020.


Index return data from Bloomberg and S&P Dow Jones Indices Index Dashboard: U.S., Canada, Europe, Asia, Fixed Income. October 30, 2020. Index performance is based on total returns and expressed in the local currency of the index.


Today, COVID-19 is no longer the unknown but the new normal and is spreading again in the U.S. and Europe. The combination of caution and restrictions on travel and hospitality continue to impede the recovery. The reopening of economies that began in May will contribute to GDP recovery, but a second wave of virus infections have been followed by localized restrictions on activity. Concern about the resurgence of the virus may well restrain demand and activity as businesses are unlikely to invest in capital spending without greater certainty and/or tax incentives. Consumers will be cautious until personal safety and employment certainty are evident, so stimulus may be muted. As a result, post-pandemic deflation is likely.

China is already achieving levels of economic activity that exceed the pre-COVID period in many sectors. This is led by exports at +9.9% y/y growth in dollar terms in September, fueled by some catch-up after first half disruptions. Industrial production was +5.6% y/y growth in August, and retail sales edged into positive territory.1 In the UK, Brexit concerns are once again returning as the negotiations between the EU and the UK remain deadlocked. The UK saw one of the largest declines in GDP in Q2 (-19.8%) compared to its peers.2 Eurozone activity rebounded sharply as economies reopened in May and June.  Second waves of the virus, especially severe in France and Spain, are hurting sentiment and highlight downside risks to recovery.

The November 3rd U.S. election hangs in the balance, with the threat of a contested election looming. Coronavirus is the most significant risk, but political uncertainty is also elevated. Lawmakers have failed to agree on another stimulus package, despite Fed Chair Powell’s repeated calls for additional fiscal help. Polls show a growing lead for Biden but potential delays in determining results and questions around a smooth transition of power could see uncertainty persist beyond November 3rd. Last month, we noted the Federal Reserve would no longer pre-emptively increase rates to cool higher inflation, and this monetary policy philosophy could trickle into other regions. This appears to have happened following the ECB’s announcement that it may consider allowing inflation to run higher for longer than usual. US dollar depreciation has been a significant trend in markets over the last few months. Historically, changes in USD have had a countercyclical relationship to global growth. There are several other longer-term factors that continue to support the recent decline. Yield compression and equity outperformance weakened the relative attractiveness of USD assets and reduced the cost of hedging for foreign holdings of USD assets. In Canada, extension of government support for households was enough for the minority Liberals to avoid a fall election. The Bank of Canada is expected to remain dovish, keeping rates at 0.25% and continuing the asset purchase program until the recovery is well underway.

Despite a slump in September, U.S. equities managed to gain over the quarter. The S&P 500 gained 8.9%, while the S&P MidCap 400 and the S&P SmallCap 600 gained 4.8% and 3.2%, respectively. Despite September’s retrenchment, Canadian equities gained in Q3, with the S&P/TSX Composite up 4.7%. Following an up and down month driven by an increase in regional COVID-19 cases, European equities declined 1.5% in September and finished Q3 down 0.03%. Continued struggles from large British banks also weighed on the S&P United Kingdom, which declined 1.7% in September and 4.8% for Q3. Asian equities ended Q3 up, with the S&P Pan Asia BMI gaining 8.9%. Most single-country indices posted quarterly gains, with Korea in the lead, up 11.5%. Gold was one of several major assets that started the quarter strong, reversed in September, but closed the quarter higher. Gold’s 3.6% September pullback was likely tactical in nature. Liquidity demands often result in Gold ETF selling as they are a highly liquid option to raise cash. Gold rallied sharply (22%) between April and July, reaching an all-time high in early August, mirrored by a stronger US dollar that finished the quarter nearly 4% lower.

In October, we maintained the asset allocations established in September. We continue to be positioned in shorter duration fixed income due to larger-than-average duration supply from the Fed. Lower rates mean lower income as inflation is positively correlated to yields. With interest rates low or negative, we maintained exposure to gold. Equity exposure to large cap reflects our view that shifting business models during this pandemic have had a negative impact on bottom lines but that select businesses are benefiting from the shift. We are continuing to monitor the recovery in Europe following the Eurozone’s agreement on a stimulus package.

Until a vaccine is available, economies continue to search for the new normal. There are numerous potential catalysts for market volatility in Q4, including a contested U.S. election result, a delayed stimulus bill, a no-Brexit scenario resulting in disrupted trade in the region, and rising global virus cases. Our approach to portfolio management is nimble, opportunistic, and deliberate in identifying asset classes that are best placed to generate returns in a new world order. Our focus is on protecting portfolios from downside risk, and we believe that our investment process is working to achieve that goal.


Deborah Frame , President and CIO


Trading Economics. China Exports. October 13, 2020.

Trading Economics. UK GDP. September 30, 2020.


Index return data from Bloomberg and S&P Dow Jones Indices Index Dashboard: U.S., Canada, Europe, Asia, Fixed Income. September 30, 2020. Index performance is based on total returns and expressed in the local currency of the index.